.avif)
.svg)
.svg)
Payer rate benchmarking is the systematic comparison of an MSO's contracted reimbursement rates, at the CPT and modifier level, against three references: Medicare, market peers, and the platform's own best-performing contracts. For PE-backed MSOs, payer rate benchmarking is one of the highest-leverage EBITDA improvement levers available, because every basis point of rate improvement flows almost entirely to EBITDA and then compounds through the EV/EBITDA multiple at exit. A disciplined rate benchmarking program typically adds 3 to 6 percent of net patient revenue to EBITDA over a hold period.
This guide is for PE operating partners, MSO CFOs, VPs of managed care, and value creation teams who measure success in dollars of EBITDA and turns of multiple. It covers what payer rate benchmarking is, why it matters more than any other near-term contract lever, the three reference points that define a complete program, and how to phase the work across a typical 5 to 7 year hold period.
What is payer rate benchmarking?
Payer rate benchmarking compares an MSO's contracted reimbursement rates against external and internal references to identify where rates are underpriced and where the platform has room to renegotiate. The work runs at the CPT and modifier level (not at the contract level), because the dollars hide in specific code and modifier combinations rather than in headline rate methodology.
Three reference points form a complete benchmarking program:
- Medicare as the universal denominator (every commercial rate can be expressed as a percentage of Medicare)
- Market rates from peer practices in the same specialty and geography, now newly accessible through federally mandated payer transparency files
- Platform best rates from the MSO's own existing contracts with the same payer
Rate benchmarking sits inside a broader category sometimes called "payer contract benchmarking," which also covers payer mix and contract terms. Rates are by far the largest dollar opportunity and the work most managed care teams prioritize first. Mix and terms are adjacent disciplines that round out the program but rarely drive EBITDA the way rates do.
This work runs alongside (and informs) the post-acquisition revenue cycle integration playbook at each add-on close, the payer contract audit that catches inherited contract issues, and the multi-TIN contract consolidation strategy that captures platform-scale negotiating leverage.
Why payer rate benchmarking is the highest-leverage EBITDA lever for PE-backed MSOs
Three economic dynamics put rate benchmarking ahead of almost every other value creation lever in a PE-backed MSO playbook.
It's cost-free revenue. Rate improvements flow almost entirely to EBITDA because they don't require additional clinical staff, additional volume, additional capacity, or additional cost. Compare that to growing EBITDA by lifting patient volume (which requires marketing spend, provider hires, and capacity build) or by cutting operating expenses (which has limits and political costs). McKinsey's research across thousands of deals shows that revenue synergies typically capture only 25 to 35 percent of announced value, but synergies tied directly to rate work tend to land closer to plan because they require less behavioral change inside the practice.
It compounds through the multiple. PE underwrites returns in part on multiple expansion, and sustained EBITDA improvement from documented rate performance is one of the cleanest stories a sponsor can tell at exit. With healthcare services trading at a median EV/EBITDA multiple of approximately 11.5x in 2025, every $1M of sustained EBITDA improvement creates roughly $11.5M in enterprise value. Platform transactions command 3 to 5 turns higher EV/EBITDA than add-on deals, partly because platforms can show this kind of disciplined value creation.
It scales with the platform. The first acquisition's rate benchmark is just a baseline. By acquisition five or ten, the MSO has benchmarks across many specialties, geographies, and payer relationships, which makes each subsequent rate audit faster, more accurate, and more useful. The capability becomes a competitive advantage on future deals because it lets the platform underwrite synergies with more confidence than competing bidders.
The EBITDA bridge from payer rate benchmarking
The clearest way to see the value is to walk through the EBITDA bridge on a typical acquired practice.
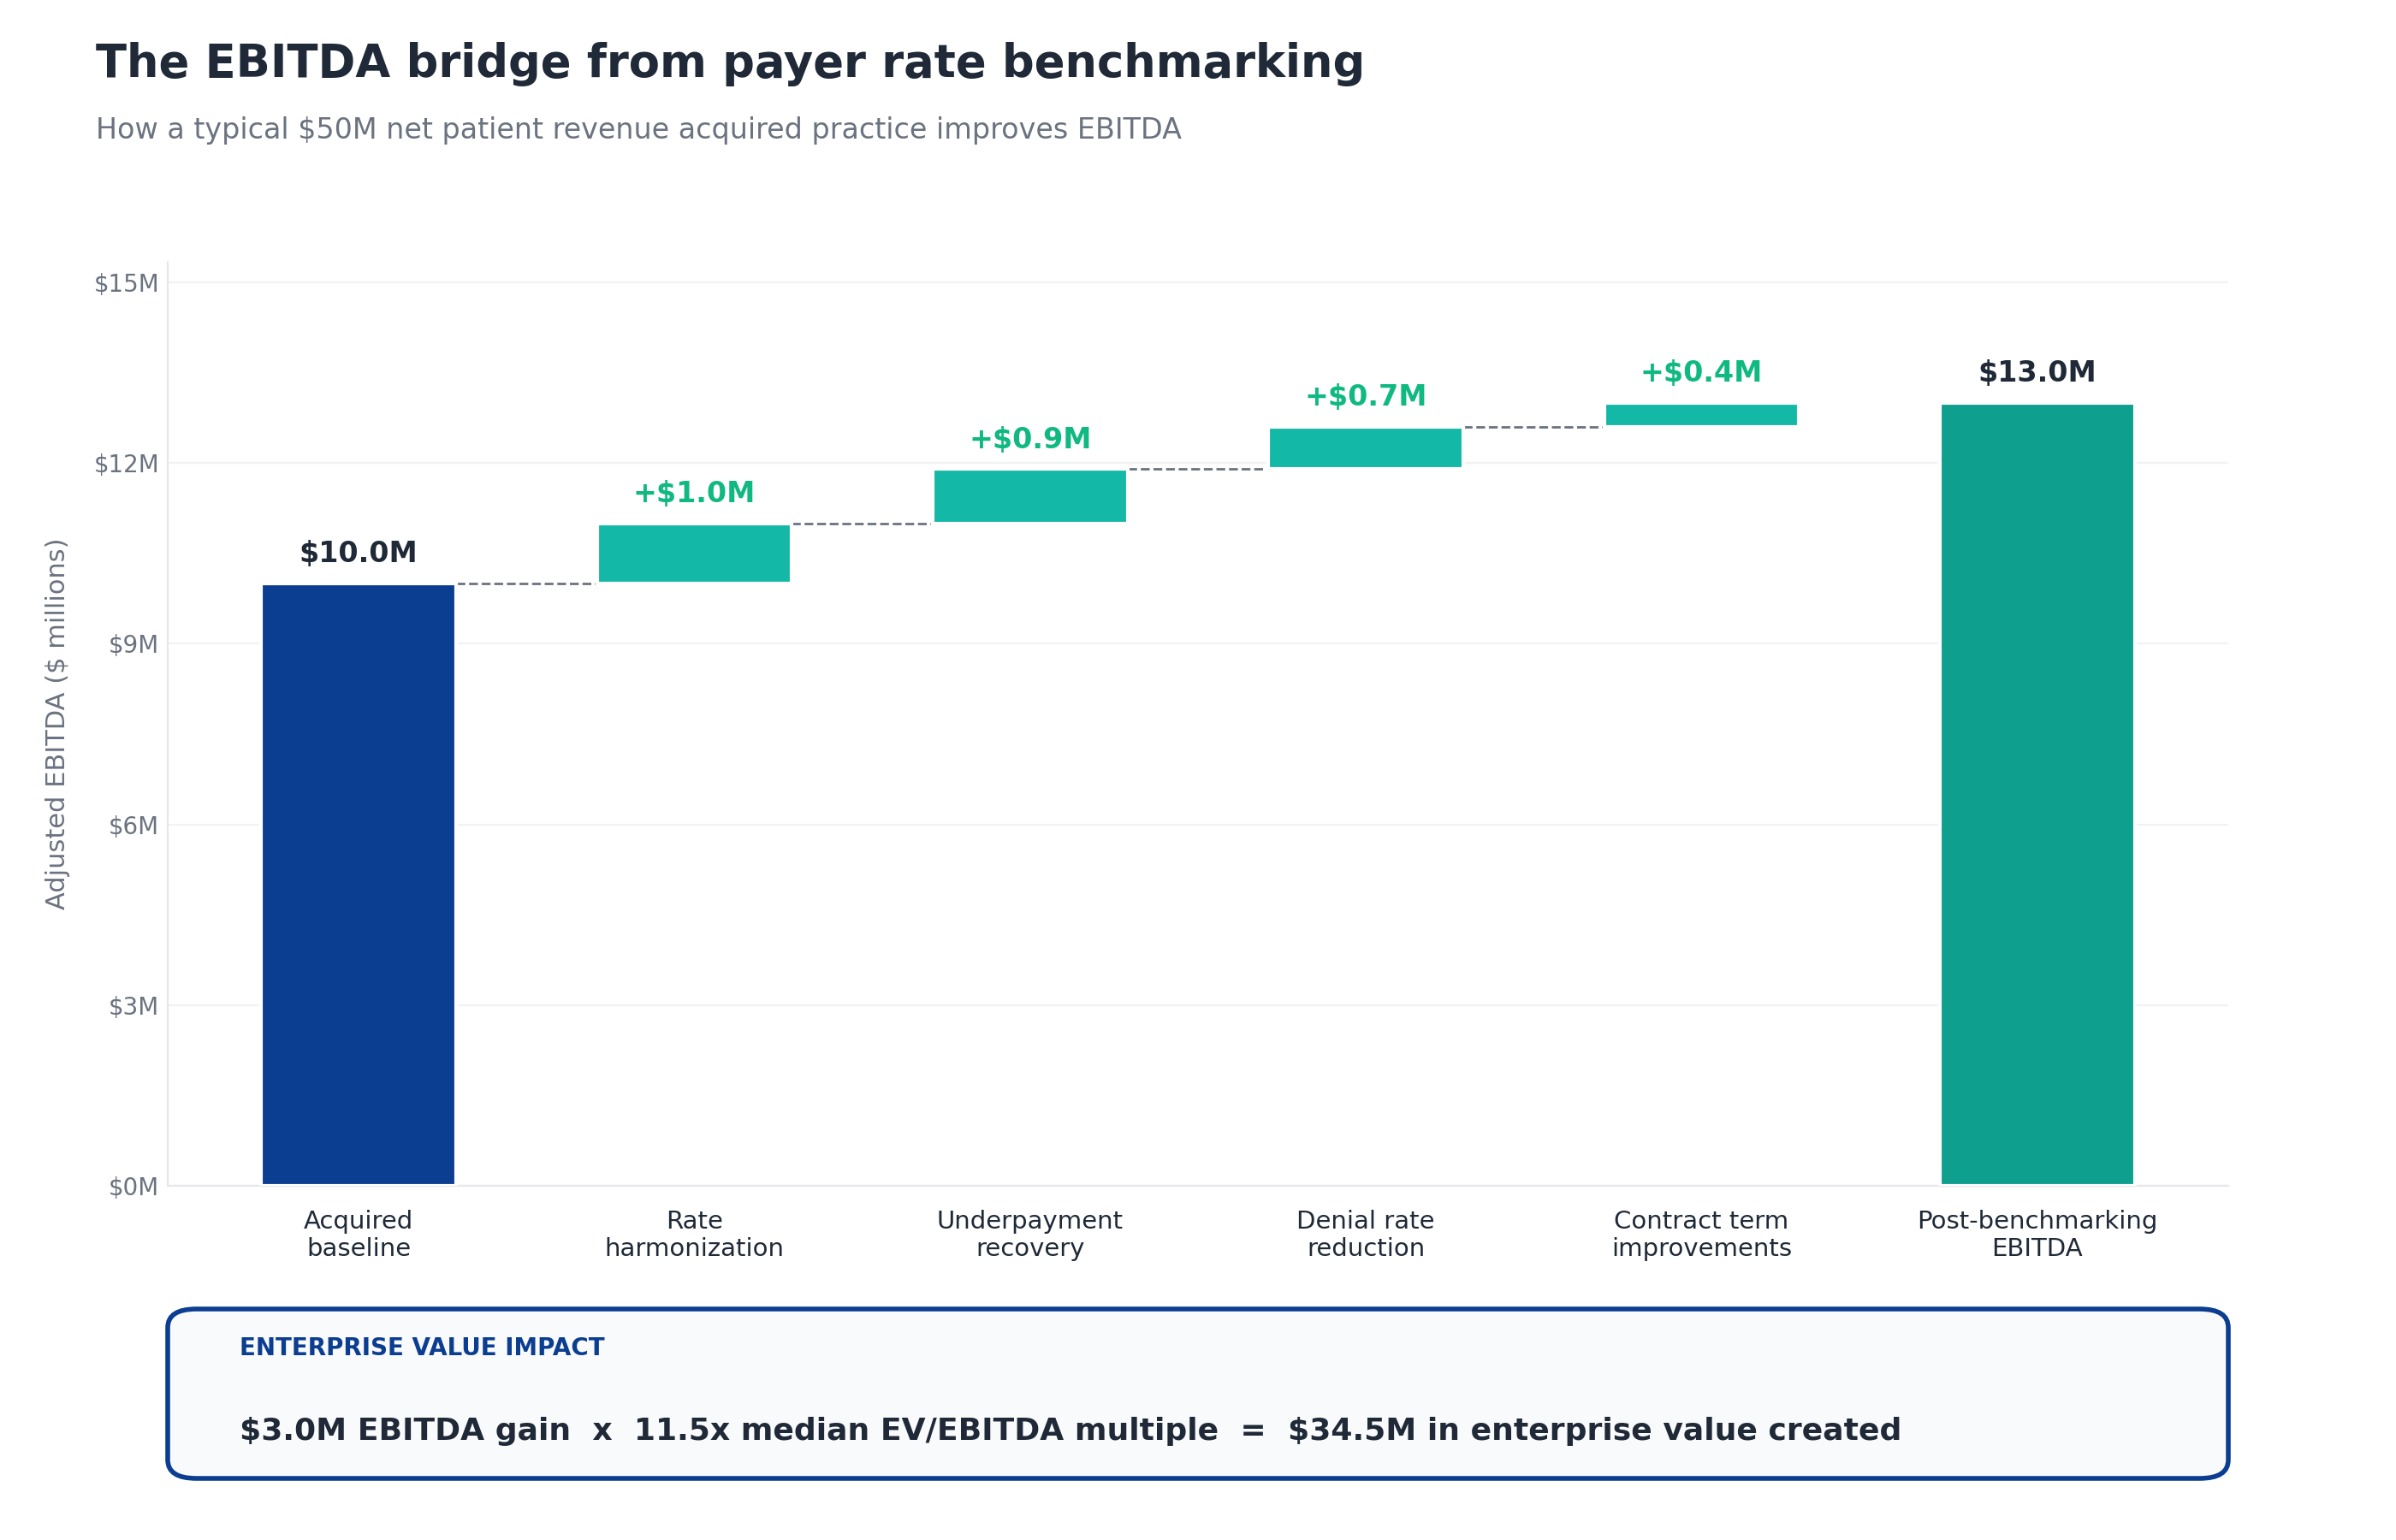
The bridge starts with an acquired practice at $50M net patient revenue and a $10M EBITDA baseline (20 percent margin). Apply the four work streams that flow out of rate benchmarking:
- Rate harmonization adds about $1M when the MSO uses platform scale to lift the acquired practice's rates upward toward the MSO's best existing contracts. This is the largest single lever for most platforms and the highest-impact output of the benchmarking work.
- Underpayment recovery adds about $0.9M from variance against contracted rates that nobody at the practice was systematically detecting. The typical range is 1 to 3 percent of net patient revenue, so $0.9M on $50M sits mid-range. This is what surfaces when the benchmarking program reveals that the payer is paying below the contracted rate, not just that the contract itself is underpriced.
- Denial rate reduction adds about $0.7M when the MSO standardizes denial workflows that often originate in rate-related disputes (incorrect modifier pricing, contract-related auth issues, fee schedule mismatches).
- Contract term improvements add about $0.4M from negotiating escalators, removing lesser-of clauses, and fixing modifier rate gaps. This is the adjacent terms work that gets done during rate renegotiation conversations.
Total EBITDA improvement: $3M, lifting EBITDA from $10M to $13M. At a 11.5x exit multiple, that $3M EBITDA improvement translates to $34.5M of enterprise value created on a single acquired entity. Across a platform of 5 to 15 add-on acquisitions, the cumulative impact compounds quickly.
The 3 reference points for payer rate benchmarking
Disciplined rate benchmarking runs against three references in parallel, not just one. Each reference reveals different gaps and drives different work.
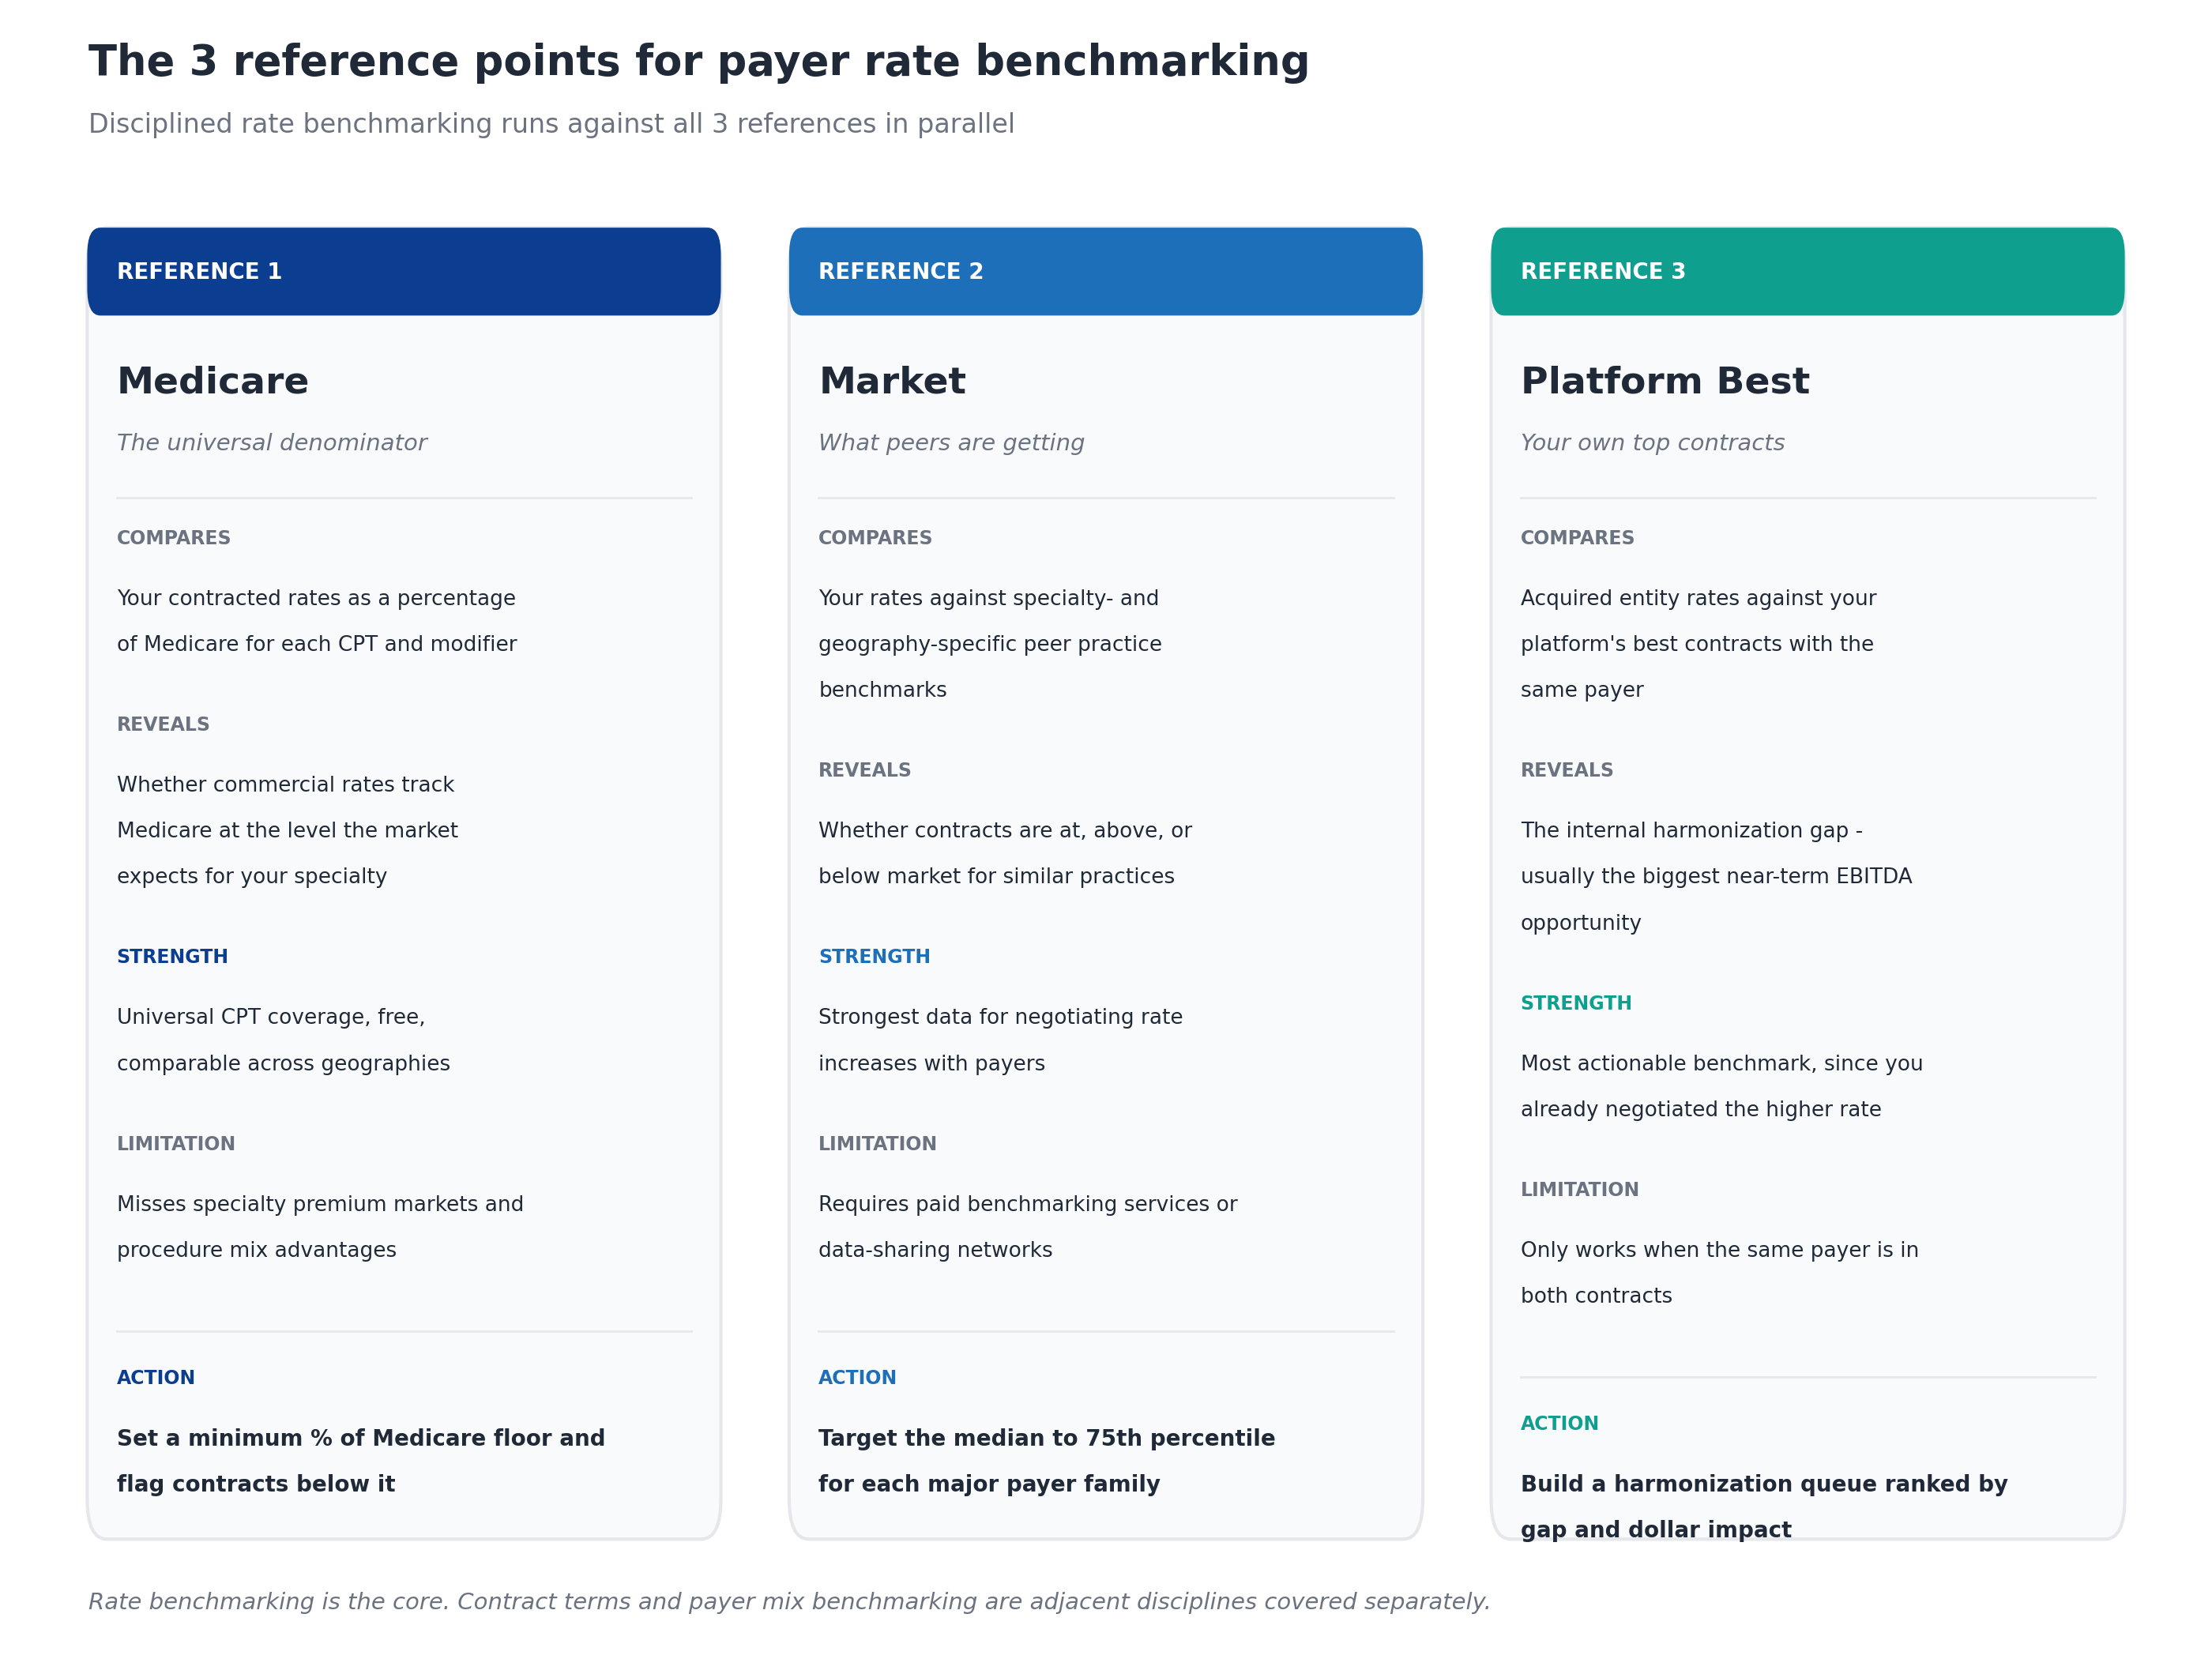
Reference 1: Medicare
Medicare is the universal denominator. Every commercial rate can be expressed as a percentage of the Medicare Physician Fee Schedule (MPFS) for the same CPT and modifier combination. This gives the MSO a single comparable number that works across geographies, payers, and specialties.
What it compares: Your contracted rates as a percentage of Medicare for each CPT and modifier.
What it reveals: Whether commercial rates track Medicare at the level the market expects for your specialty. Most commercial contracts price at 120 to 180 percent of Medicare for primary care and 150 to 250 percent for procedural specialties. Anything below those ranges is a red flag.
Strength: Universal CPT coverage, free to obtain, comparable across markets.
Limitation: Misses specialty premium markets and the procedure mix advantages some practices have. A surgery-heavy practice may legitimately deserve a higher percentage of Medicare than the typical practice mix would suggest.
Action: Set a minimum percentage of Medicare floor for each specialty and payer type, then flag every contract below it for review.
Reference 2: Market
Market benchmarking compares your rates against specialty-specific and geography-specific peer practice rates. The data comes from paid benchmarking services, MSO data-sharing networks, or specialty society surveys.
What it compares: Your rates against specialty- and geography-specific peer practice benchmarks.
What it reveals: Whether contracts are at, above, or below market for similar practices in similar markets. Two practices in the same metro can have meaningfully different rates with the same payer because of negotiation history, specialty mix, or referral patterns. The benchmark tells you where you sit relative to peers.
Strength: This is the strongest data for negotiating rate increases with payers. When you can show a payer that your rate is at the 35th percentile of comparable practices in the market, the conversation changes.
Limitation: Historically this required expensive paid benchmarking services, MSO data-sharing networks, or hand-collected data from specialty society surveys. Data quality varied, and self-reported sources often skewed toward optimistic numbers.
Action: Target the median to 75th percentile for each major payer and CPT family, with stretch goals for high-volume codes.
What changed for market benchmarking. Federal price transparency rules now require payers to publish their negotiated rates in machine-readable files. The files themselves are nearly unusable in raw form (massive, inconsistent, constantly changing, and not structured for operational use), but purpose-built tools have made the data accessible. MD Clarity's Payer Benchmarking ingests, cleans, and standardizes these payer transparency files so managed care teams can compare their contracted rates against competitors in the same market, payer by payer and CPT code by CPT code. The data lands in familiar contracting formats (conversion factors and service-line groupings), ready for negotiation prep, renewal cycle target-setting, financial forecasting, and new-market evaluation. For PE-backed MSOs, this turns market benchmarking from a once-a-year consulting engagement into an always-on capability that any add-on acquisition inherits on Day 1.
Reference 3: Platform best
Platform-best benchmarking compares acquired entity rates against the MSO's own strongest existing contracts with the same payer. This is the most actionable benchmark because the higher rate has already been negotiated, which means it exists in the market and the MSO already has the data to support it.
What it compares: Acquired entity rates against your platform's best contracts with the same payer.
What it reveals: The internal harmonization gap, which is usually the biggest near-term EBITDA opportunity for any MSO making acquisitions. Acquired practices almost always have weaker rates than the MSO platform (that's often part of why the MSO is acquiring them).
Strength: Most actionable benchmark, since you already negotiated the higher rate. The payer cannot credibly argue that the rate is unreasonable when it's paying that rate to your sister entity.
Limitation: Only works when the same payer is in both contracts. Markets where the acquired practice has a payer mix that doesn't overlap with the MSO platform won't generate platform-best comparisons.
Action: Build a harmonization queue ranked by gap-to-platform-best and dollar impact. Prioritize the biggest dollar gaps and the easiest paths to harmonization.
How payer rate benchmarking fits within broader contract benchmarking
Rate benchmarking is the core, but two adjacent disciplines round out the full program.
Payer mix benchmarking compares the share of revenue coming from commercial, Medicare Advantage, traditional Medicare, and Medicaid against specialty and regional benchmarks. Mix matters for valuation: FOCUS Investment Banking notes that practices with predominantly commercial payor mix may achieve 40 to 60 percent higher exit multiples than Medicaid-heavy peers. Mix is not a near-term lever the way rates are, but it shapes the long-term growth thesis.
Contract terms benchmarking compares the legal and operational terms in each contract (escalators, termination clauses, lesser-of provisions, renewal language, prompt-pay terms) against market standard. Terms work usually surfaces during rate renegotiation conversations rather than as a standalone effort, but it captures 0.5 to 1.5 percent of net patient revenue that headline rates don't show. For more detail on the terms a contract audit typically catches, see the article on how to audit payer contracts after acquiring a practice.
Most platforms run rate benchmarking continuously and treat mix and terms as periodic reviews tied to the broader contract audit cycle.
How to calculate the EBITDA impact of rate benchmarking
The math is straightforward once the benchmarks are in place. For each acquired practice or platform entity:
- Calculate net patient revenue (NPR) at the entity level for the trailing 12 months
- Estimate the rate uplift opportunity as the volume-weighted gap between current rates and the appropriate benchmark (platform-best is usually the closest available target). A typical opportunity is 2 to 4 percent of NPR.
- Estimate the underpayment recovery opportunity by sampling 12 months of remits and calculating variance against contracted rates. This typically runs 1 to 3 percent of NPR.
- Estimate the rate-related denial reduction opportunity by comparing the entity's first-pass denial rate to platform benchmarks. Every 1 percent reduction in denial rate above benchmark recovers approximately 0.5 percent of NPR.
- Estimate the contract terms opportunity by reviewing escalators, lesser-of clauses, and modifier rate gaps. This typically adds 0.5 to 1.5 percent of NPR.
Sum the four estimates. The total opportunity typically falls between 3 percent and 9.5 percent of NPR, with mid-range platforms landing around 5 to 6 percent.
Because rate-driven improvements flow almost entirely to EBITDA (no additional cost), the EBITDA gain roughly equals the NPR gain. A $50M NPR entity with a 6 percent opportunity captures about $3M of EBITDA improvement.
Then translate to enterprise value. Apply the platform's expected exit multiple. At 11.5x, $3M of EBITDA improvement equals $34.5M of enterprise value. At higher multiples available to scaled platforms with strong payer diversification and ancillary revenue, the same EBITDA improvement creates substantially more value.
The PE hold period payer rate benchmarking roadmap
PE sponsors typically hold portfolio companies for 5 to 7 years, and rate benchmarking work has different priorities at different points in that hold. Front-loading the quick wins captures early EBITDA that funds the rest of the platform build.
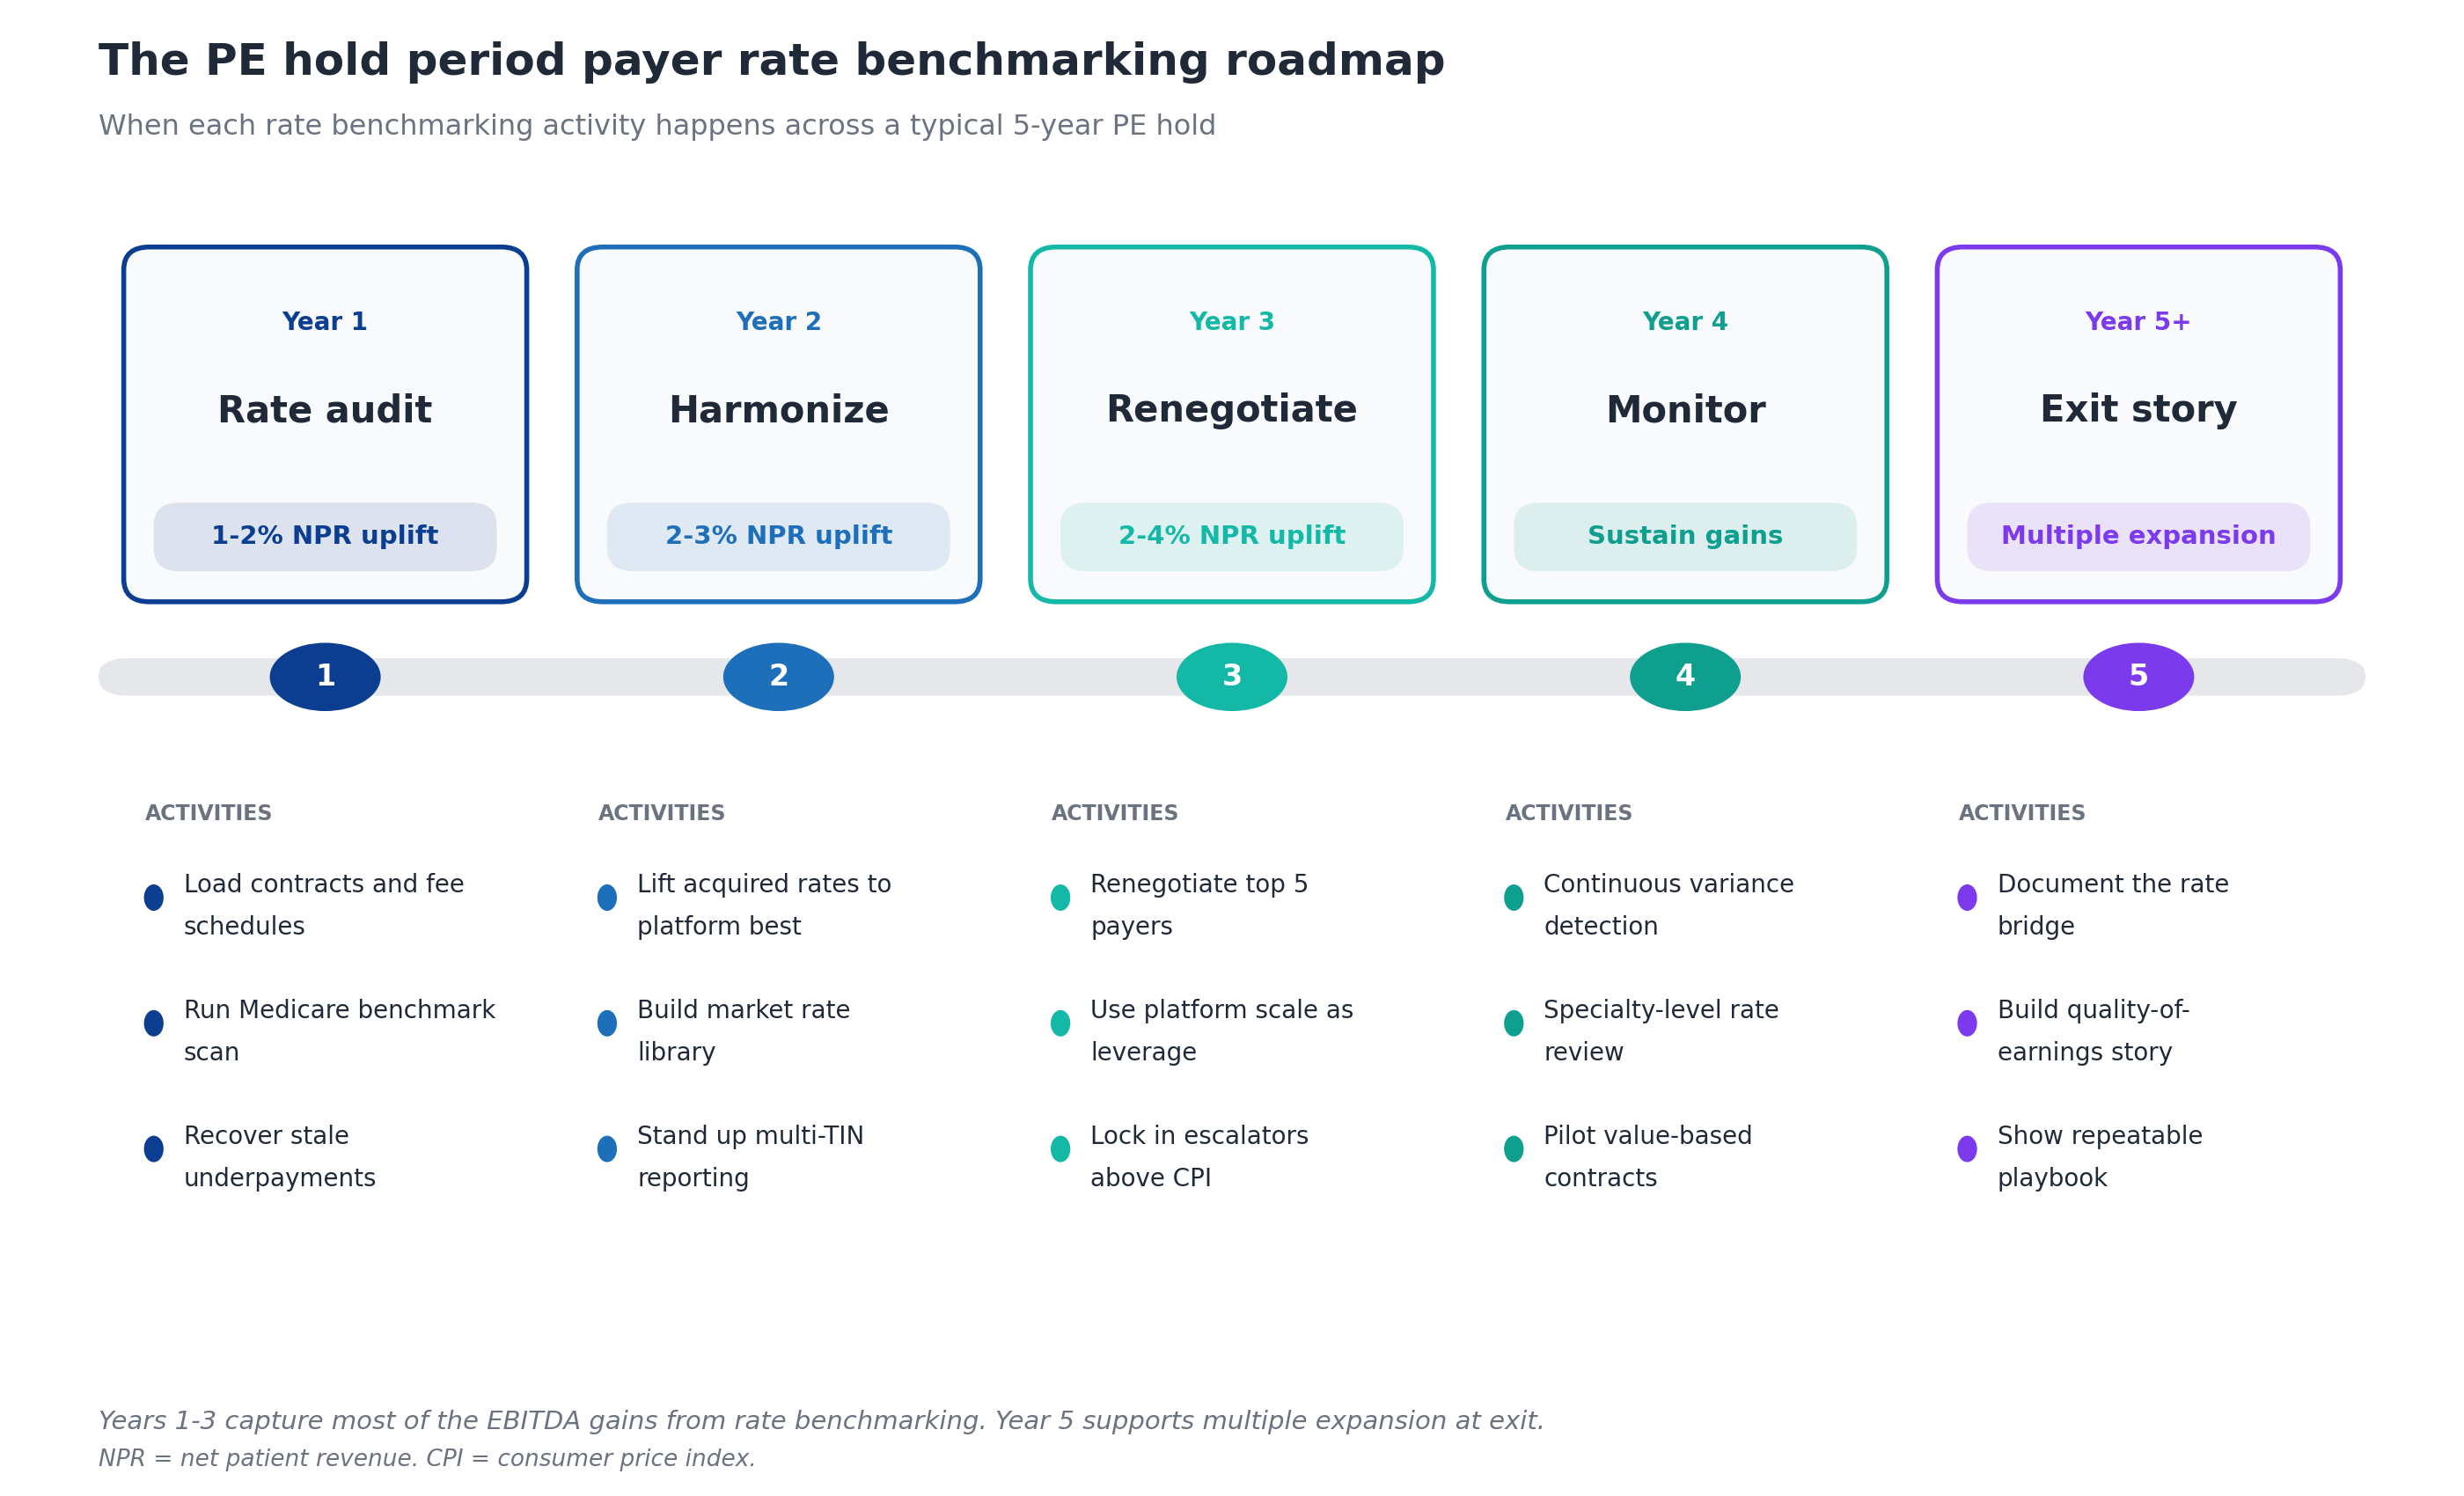
Year 1: Rate audit. Load every payer contract and fee schedule into a contract management platform at the CPT level. Run the Medicare benchmark scan to identify the worst-priced contracts. Recover stale underpayments before timely filing deadlines (often 90 to 180 days, so speed matters). Expected uplift: 1 to 2 percent of NPR. This year funds the platform-level managed care capability that drives Years 2 through 5.
Year 2: Harmonize. Lift acquired entity rates upward toward the MSO's platform-best rates with each payer. Build the market rate library that supports Year 3 renegotiations. Stand up multi-TIN reporting that lets central management see the platform as one operation. Expected uplift: 2 to 3 percent of NPR.
Year 3: Renegotiate. Use the documented platform performance from Years 1 and 2 to renegotiate the top 5 payers. Push for escalators above CPI, lock in favorable renewal terms, push back on lesser-of clauses. This is the year that platform scale converts to dollars. Expected uplift: 2 to 4 percent of NPR.
Year 4: Monitor. Move from project-based work to continuous variance detection. Specialty-level rate review for outliers. Pilot value-based contracts in markets where MA penetration supports them. Expected outcome: sustain the Year 1-3 gains and identify the next wave.
Year 5+: Exit story. Document the rate bridge (where each EBITDA dollar came from), build the quality-of-earnings story for buyer diligence, demonstrate that the playbook is repeatable for the next sponsor. Expected outcome: multiple expansion at exit.
How does payer rate benchmarking support multiple expansion at exit?
Multiple expansion is what separates a good PE return from a great one. The same EBITDA at a higher multiple is the cleanest source of incremental return because it doesn't require operational change. Three elements of rate benchmarking support multiple expansion specifically.
Quality of earnings. Buyers in healthcare M&A heavily discount EBITDA that depends on one-time events or unsustainable rates. EBITDA built through systematic rate benchmarking and renegotiation is the opposite: documented, repeatable, supported by audit trails showing exactly where each dollar came from. Quality of earnings analysis at exit consistently rewards this pattern.
Repeatable playbook. Sponsors selling to other sponsors (the most common PE healthcare exit) want to show the next sponsor can keep growing. A documented rate benchmarking playbook (with templates, KPIs, technology, and trained managed care staff) demonstrates the platform has continued value creation runway under the next owner. Bain's healthcare PE report found that global healthcare private equity delivered record performance in 2025 with disclosed deal value exceeding $191 billion, and the platforms attracting the highest multiples were those with repeatable operating capabilities, not just one-time integration wins.
Payer diversification. Rate benchmarking surfaces payer concentration risk and drives the work to reduce it. Platforms with no single payer above 25 percent of revenue typically command higher multiples than concentrated platforms, because buyers underwrite less risk. FOCUS Investment Banking notes that practices with strong payor diversification and ancillary revenue achieve multiples up to 2x higher than less diversified peers.
Common PE-backed MSO mistakes in payer rate benchmarking
After watching many platforms run this play, certain mistakes recur.
Benchmarking against only one reference. Platforms that only run the Medicare benchmark miss the harmonization opportunity (which platform-best surfaces) and the negotiation leverage (which market data provides). All three references are needed for a complete program.
Waiting too long to start. Some platforms wait until Year 3 of the hold to build the benchmarking capability. By that point, two years of recoverable underpayments have aged out of timely filing windows, and the Year 1-2 EBITDA that would have funded later investment is gone.
Benchmarking at the contract level instead of the CPT level. Headline rate methodology (percent of Medicare, fixed dollar, case rate) hides the variation that matters. The dollars are in specific CPT and modifier combinations that headline methodology smooths over. Benchmarking needs to run at the CPT and modifier level to be useful.
Treating it as a finance function instead of an operating capability. Rate benchmarking lives at the intersection of managed care, revenue cycle, finance, and legal. Platforms that treat it as a finance-only initiative miss the operational mechanics of recovery and renegotiation.
Skipping the technology investment. Manual rate benchmarking does not scale past 2 to 3 acquisitions. Trying to run platform-scale variance analysis in spreadsheets reliably misses the long tail of small underpayments that, in aggregate, account for 60 to 70 percent of the recoverable dollars.
Failing to document the value created. EBITDA gains that aren't traced back to specific rate benchmarking activities don't tell the quality of earnings story at exit. The audit trail matters as much as the dollar amount.
Technology requirements for payer rate benchmarking
Four technology categories make rate benchmarking work at PE-backed MSO scale.
Contract management with CPT-level fee schedules. The platform needs to ingest every payer contract and every fee schedule across every TIN, with rate data captured at the CPT and modifier level (not at the contract level). Generalist contract management tools often struggle here because they were built for single-entity organizations or for contract terms management rather than fee schedule analysis.
Underpayment detection at scale. Once contracts are loaded with fee schedules, the same engine should be detecting variances on every TIN against the right rate, routing recovery work to the appropriate team, and tracking recovery success rates.
Market rate benchmarking from payer transparency files. This is the capability that transforms market comparison from a periodic consulting project into a continuous operating function. The technology pulls payer transparency files at scale, cleans and standardizes the data, and makes it searchable by CPT code, payer, competitor set, and region. MD Clarity's Payer Benchmarking delivers this capability with output in familiar contracting formats (conversion factors, service-line groupings) so the managed care team can answer questions like "are our rates above, at, or below what peers receive for the same CPT codes" and "which payer relationships show the biggest gaps from market norms."
Rate scenario modeling and reporting. Beyond detection and benchmarking, the technology should support rate scenario modeling (what would happen to EBITDA if Payer X rates increased 3 percent?), Medicare benchmark comparison, platform-best harmonization analytics, and roll-up reporting from CPT to TIN to platform level. This is the analytical layer that supports renegotiation strategy, Year 1 underwriting, and board-level visibility.
For a deeper look at how these capabilities integrate, MD Clarity's guide to payer contract management for MSOs walks through the operating model and integration points, and the guide to making fee schedule reimbursement work covers the CPT-level mechanics in more detail.
Frequently asked questions about payer rate benchmarking
What is payer rate benchmarking?
Payer rate benchmarking is the systematic comparison of an MSO's contracted reimbursement rates, at the CPT and modifier level, against three references: Medicare, market peers, and the platform's own best-performing contracts. The work identifies where rates are underpriced relative to comparable benchmarks and prioritizes the gaps by dollar impact.
How much EBITDA improvement can rate benchmarking realistically achieve?
Most PE-backed MSO platforms can capture 3 to 6 percent of net patient revenue in EBITDA improvement through systematic rate benchmarking over a 3 to 5 year hold period. The upper end of the range (6 to 9 percent) is achievable for platforms with significant inherited contract issues, while the lower end (2 to 3 percent) is typical for platforms with stronger baseline contracting.
What's the difference between rate benchmarking and contract benchmarking?
Rate benchmarking focuses specifically on contracted reimbursement rates at the CPT and modifier level. Contract benchmarking is a broader category that includes rates plus payer mix benchmarking and contract terms benchmarking. Rate benchmarking is the largest dollar opportunity and the work most managed care teams prioritize first. Mix and terms are adjacent disciplines that round out the full program.
How does rate benchmarking translate to enterprise value?
EBITDA gains from rate benchmarking translate to enterprise value through the EV/EBITDA multiple. With healthcare services trading at a median multiple of approximately 11.5x in 2025, every $1M of sustained EBITDA improvement creates roughly $11.5M of enterprise value. Platform-scale MSOs commanding higher multiples (mid-teens for premium specialties) capture even more value per dollar of EBITDA gained.
When should a PE-backed MSO start rate benchmarking?
Rate benchmarking should start in pre-close diligence on the platform investment and continue through every add-on acquisition. Sponsors that wait until the post-close integration phase typically miss the first wave of recoverable underpayments (which age out of timely filing) and the rate context that supports purchase price negotiation.
What is the most important reference point in rate benchmarking?
Platform-best benchmarking is usually the most actionable reference for an MSO with multiple acquisitions, because the higher rate already exists in the same payer's portfolio. Medicare is the most universal reference and the easiest to obtain. Market data is the strongest negotiation lever. A complete program runs all three in parallel.
How do payer transparency files support market benchmarking?
Federal price transparency rules require commercial payers to publish their in-network negotiated rates in machine-readable files. The files contain the rate data managed care teams have always wanted but were historically unable to obtain. The challenge is that the raw files are enormous, formatted inconsistently across payers, and updated continuously, which makes them effectively unusable without purpose-built tooling. Solutions like MD Clarity's Payer Benchmarking ingest, clean, and standardize these files so that contracted rates can be compared across providers and payers at the CPT level, in formats contracting teams already use.
What use cases does market rate benchmarking support beyond rate negotiation?
Market rate benchmarking supports at least four additional use cases beyond direct payer negotiation: financial forecasting (modeling revenue under different rate scenarios), new market evaluation (estimating reimbursement before entering a new geography), service-line gap analysis (identifying specialties where rates lag peers), and leadership alignment (giving the board and operating team a shared, data-grounded view of payer behavior). For PE-backed MSOs evaluating add-on acquisitions, the same data also supports diligence on the target's rate competitiveness before the deal closes.
Does rate benchmarking work for value-based care arrangements?
Yes, but the mechanics shift. Value-based contracts have per-member-per-month payments, attribution rules, shared savings thresholds, and quality bonus pools rather than CPT-level fee schedules. The benchmarking discipline applies the same way (compare against external and internal references), but the units of analysis are different. Most platforms run separate benchmarking workflows for fee-for-service and value-based contracts.
How long does it take to build rate benchmarking capability?
A basic capability (contract inventory, fee schedule loading, variance detection on top payers) can be stood up in 90 to 120 days. A mature capability that supports continuous benchmarking against all three references, scenario modeling, and renegotiation strategy across multiple TINs typically takes 12 to 18 months to build, including technology deployment and team development.
Build rate benchmarking into the value creation playbook
Payer rate benchmarking is the highest-leverage near-term EBITDA improvement lever available to a PE-backed MSO. The dollars flow almost entirely to EBITDA, compound through the exit multiple, and demonstrate the kind of documented operational improvement that supports multiple expansion. The platforms that run this discipline well outperform their peers not because they have better assets but because they extract more value from the same assets.
MD Clarity helps PE-backed MSO managed care, revenue cycle, and finance teams benchmark payer rates across every TIN in the platform, detect underpayments at scale, and report platform performance from board level down to the CPT level. Request a demo or read about how an orthopedics MSO found $10.3 million in underpayments using this exact framework.
FAQs
Get paid in full by bringing clarity to your revenue cycle
Related Posts


Subscribe to the

Healthcare Clarified newsletter
Get the latest insights on RCM and healthcare policy in your inbox
