.avif)
.svg)
.svg)
Revenue leakage in a newly acquired physician practice is the gap between the revenue the practice should be capturing under its existing contracts and patient mix and the revenue it actually collects. For a typical acquired practice, that gap runs between 6 and 16 percent of net patient revenue annually, distributed across seven different sources that each hide in different places and require different recovery work. Most of it is invisible until someone goes looking.
This guide is for MSO VPs of revenue cycle, managed care directors, and integration program managers who need a concrete map of where leakage occurs, how to size it, and how to recover it. It covers the seven leakage sources in detail, the diagnostic tests that surface each one, the recovery playbook with timing and sequencing, and the common mistakes that leave money on the table.
What is revenue leakage in a post-acquisition physician practice?
Revenue leakage is the difference between earned revenue and collected revenue, captured net of legitimate adjustments. It is distinct from a few related concepts that often get conflated:
- Lost revenue typically refers to revenue that was never earnable in the first place (missed appointments, lost referrals, services priced too low). Leakage applies to revenue the practice was contractually entitled to.
- Write-offs are accounting adjustments that recognize the loss after the fact. Leakage is the underlying operational failure that produces the write-off.
- Denials are one source of leakage, not the same thing. A denied claim that gets successfully appealed produces no leakage; a denied claim that never gets worked produces a write-off.
Newly acquired practices are uniquely exposed to leakage because of a combination of factors that compound at the moment of close: missing or scattered payer contract documentation, no continuous variance detection against contracted rates, manual denial workflows, weak credentialing tracking, and personnel turnover during the transition. Each factor on its own creates moderate exposure. Together they produce the 6 to 16 percent range that makes leakage one of the highest-leverage opportunities in any MSO add-on acquisition.
For the full integration framework that surrounds this work, see the post-acquisition revenue cycle integration playbook. For the contract-specific diagnostic work, see the payer contract audit guide.
How much revenue actually leaks?
The mid-point of typical ranges across all seven leakage sources sums to roughly 12 percent of net patient revenue annually. The full distribution looks like this.
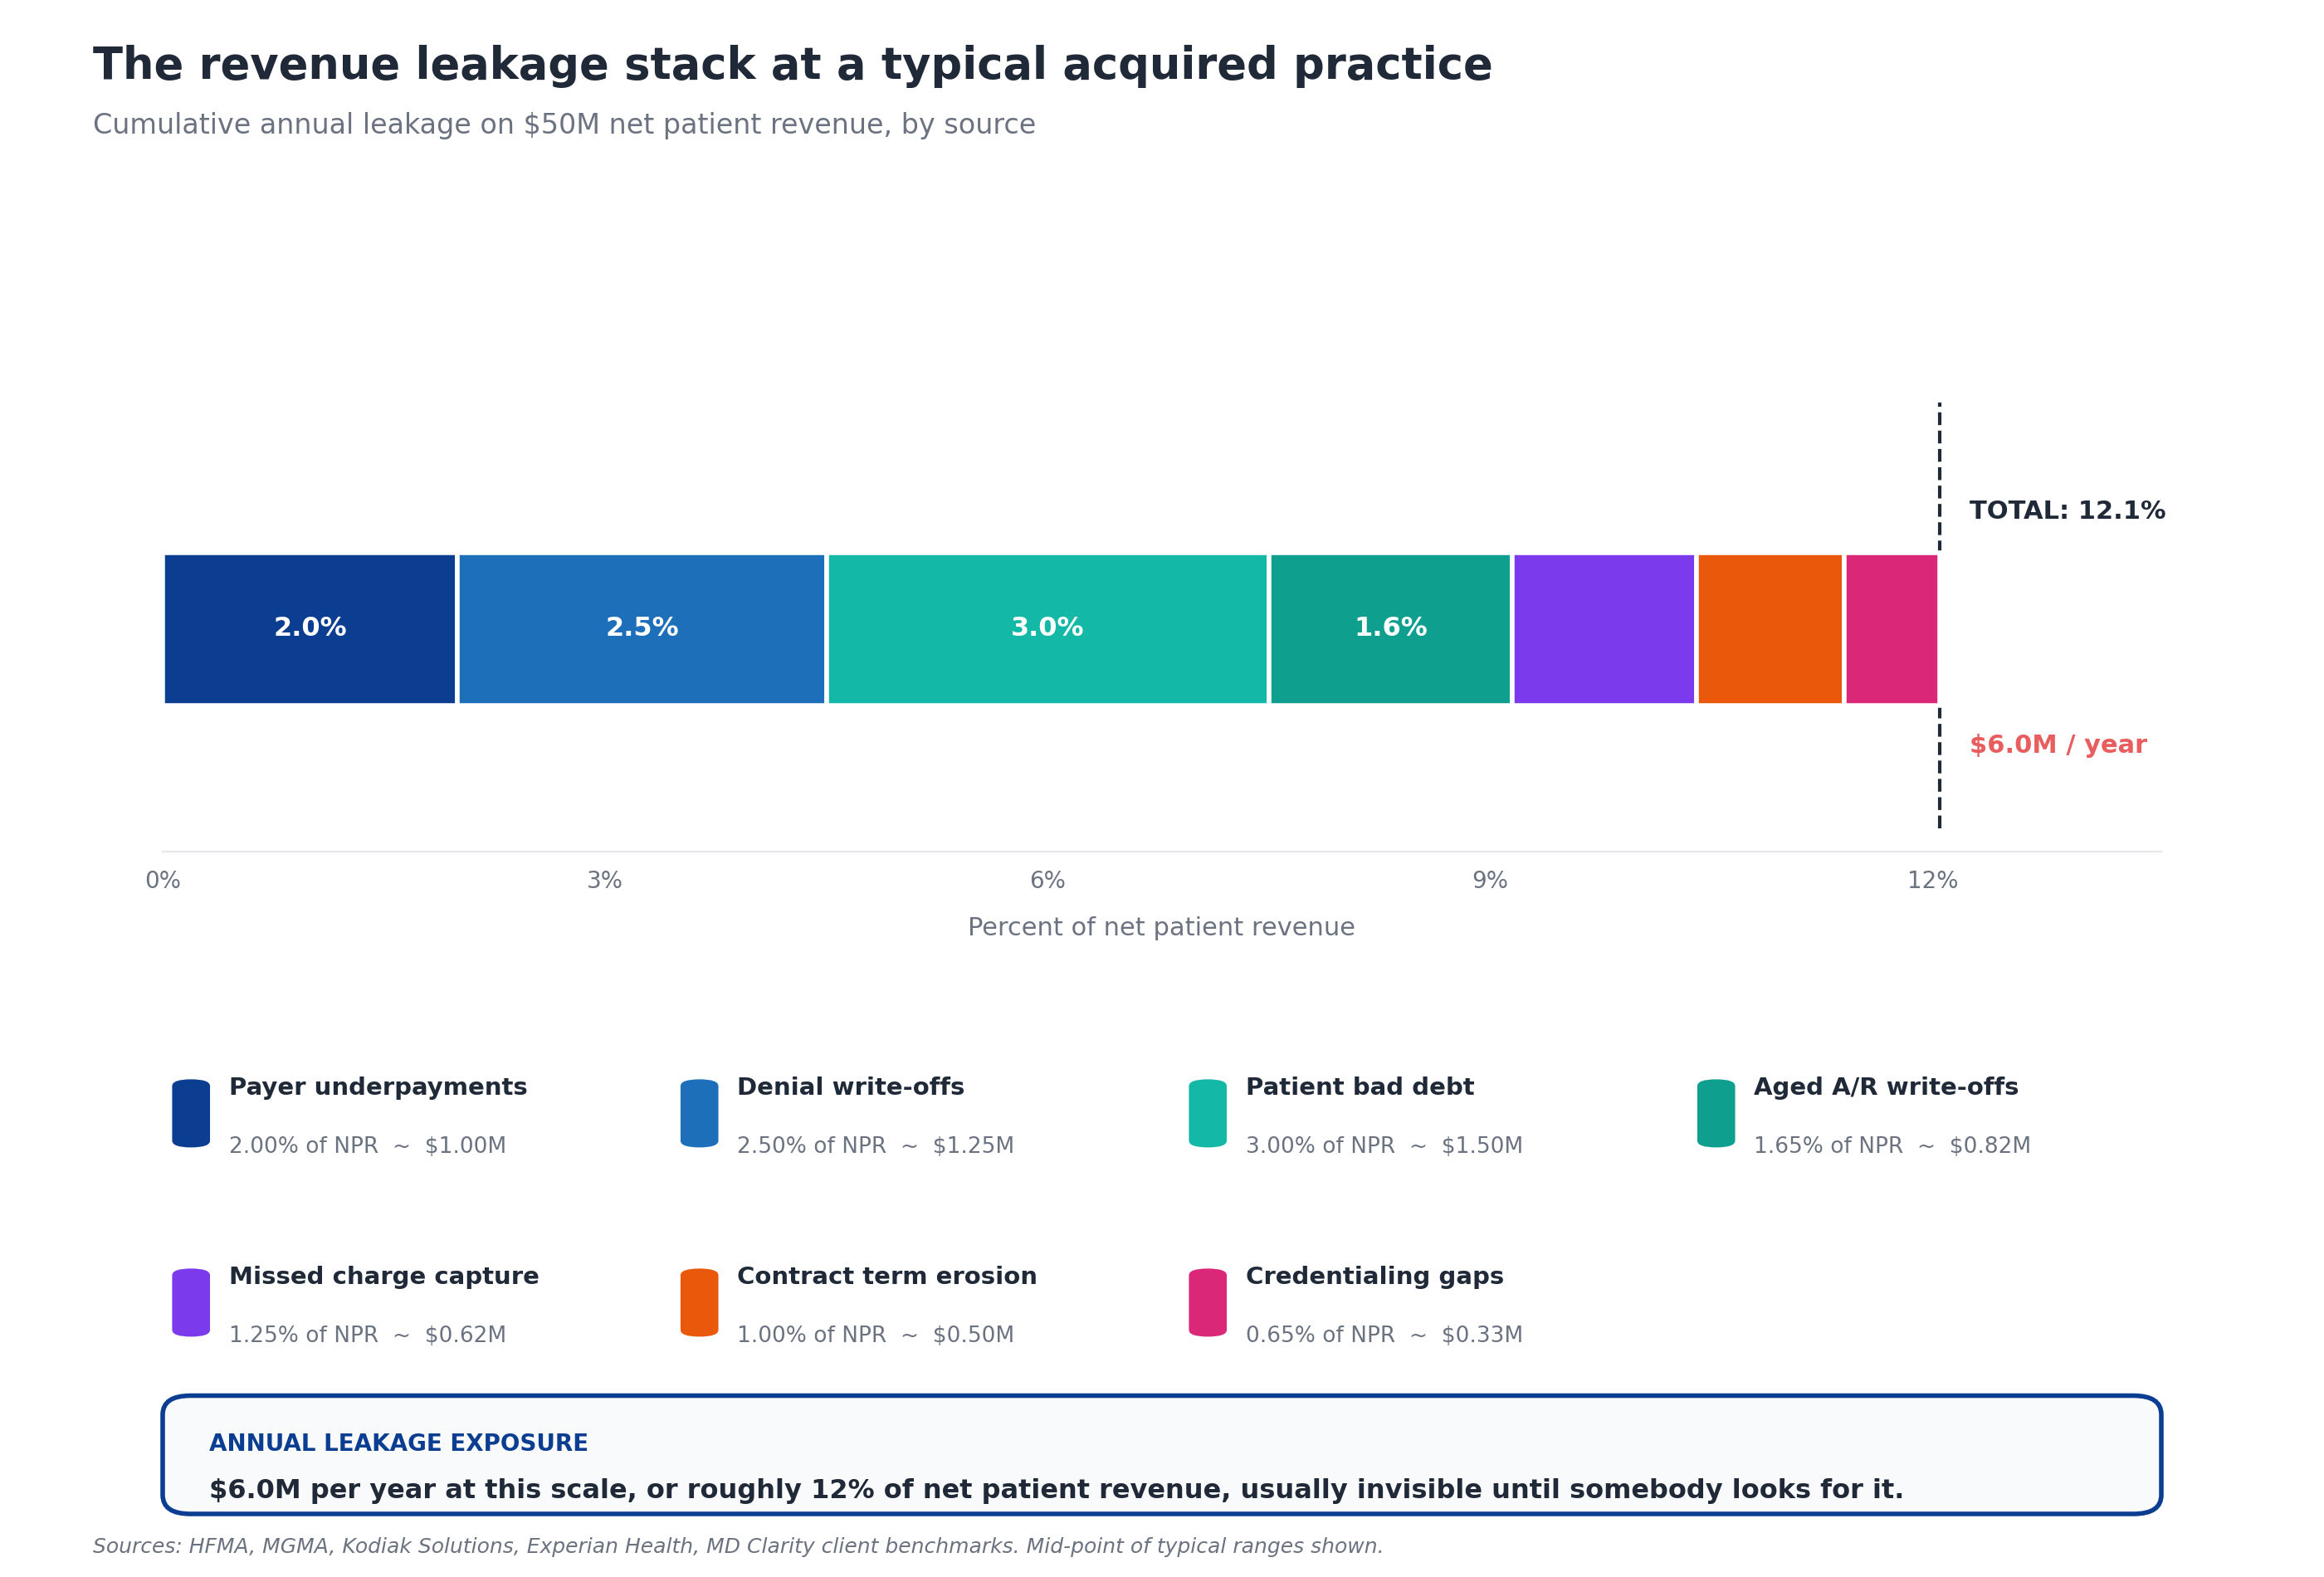
For a $50 million net patient revenue practice, that 12 percent represents $6 million per year in recoverable annual exposure. For a $200 million MSO platform spanning multiple acquired entities, the same percentage represents $24 million per year. These numbers consistently surprise PE operating partners and CFOs because nothing in a target's pre-close financial statements suggests the gap exists. The practice was profitable. The cash collection looked normal. The audit produced clean opinions. The leakage was simply not visible because nobody had the tools to look for it.
The dollar exposure also explains why MSO platforms with mature revenue leakage detection capabilities outperform their peers. Industry estimates put payer underpayments alone at 1 to 3 percent of net patient revenue annually, and that's just one of seven sources. Initial claim denial rates hit 11.8 percent in 2024, with the cost to rework a single denied claim ranging from $25 to $181. Patient collection rates fell to 47.8 percent in 2023. Each of these numbers points to a different leakage source, all of which compound in the same practice at the same time.
Why acquired practices leak more revenue than steady-state practices
Steady-state practices have their own leakage, but acquired practices typically run two to three times higher exposure for five specific reasons.
No continuous variance detection. Most independent practices have no system that compares paid amounts against contracted rates at the CPT and modifier level. They look at the EOB, see a payment, and post it. If the payment is 5 percent below the contracted rate, no alert fires. Industry-typical variance is 1 to 3 percent of net patient revenue, and it accumulates silently year over year.
Documentation gaps from the acquisition transition. Payer contracts get filed in shared drives, paper file cabinets, and the personal email of long-tenured office managers. When the acquisition closes, some of those documents disappear or never get located. Without complete contracts, neither variance detection nor renegotiation is possible.
Personnel turnover during transition. The billing manager, the credentialing lead, and the lead biller often leave within 6 to 12 months of close. They take undocumented knowledge with them: which payer reps return calls, which denial codes always need supplementary clinical notes, which providers chronically code below their actual work. The institutional knowledge gap directly produces leakage.
Manual denial workflows. Many independent practices have no formal denial categorization, no appeals tracking, and no escalation process for high-dollar denials. Claims get denied, sit in a work queue, age past appeal deadlines, and become permanent write-offs. The cost-to-rework economics combined with limited staff bandwidth mean low-dollar denials are routinely abandoned.
Credentialing gaps that nobody is monitoring. Providers bill under TINs they aren't fully credentialed for. Credentialing expirations aren't tracked centrally. New payers get added to the contracted list without provider rosters being updated. Each gap produces small but persistent leakage that doesn't surface until someone runs a cross-reference report.
The structural advantage MSO platforms have over independent practices on revenue leakage is exactly the inverse of these five factors: continuous variance detection, centralized contract management, repeatable integration playbooks, standardized denial workflows, and active credentialing monitoring. Captured well, that advantage produces the 6 to 16 percent of NPR that the EBITDA bridge depends on.
The 7 sources of revenue leakage in post-acquisition practices
Each source has a distinct mechanic, a typical size range, a hiding place, and a diagnostic test that surfaces it. Most acquired practices leak from all seven simultaneously.
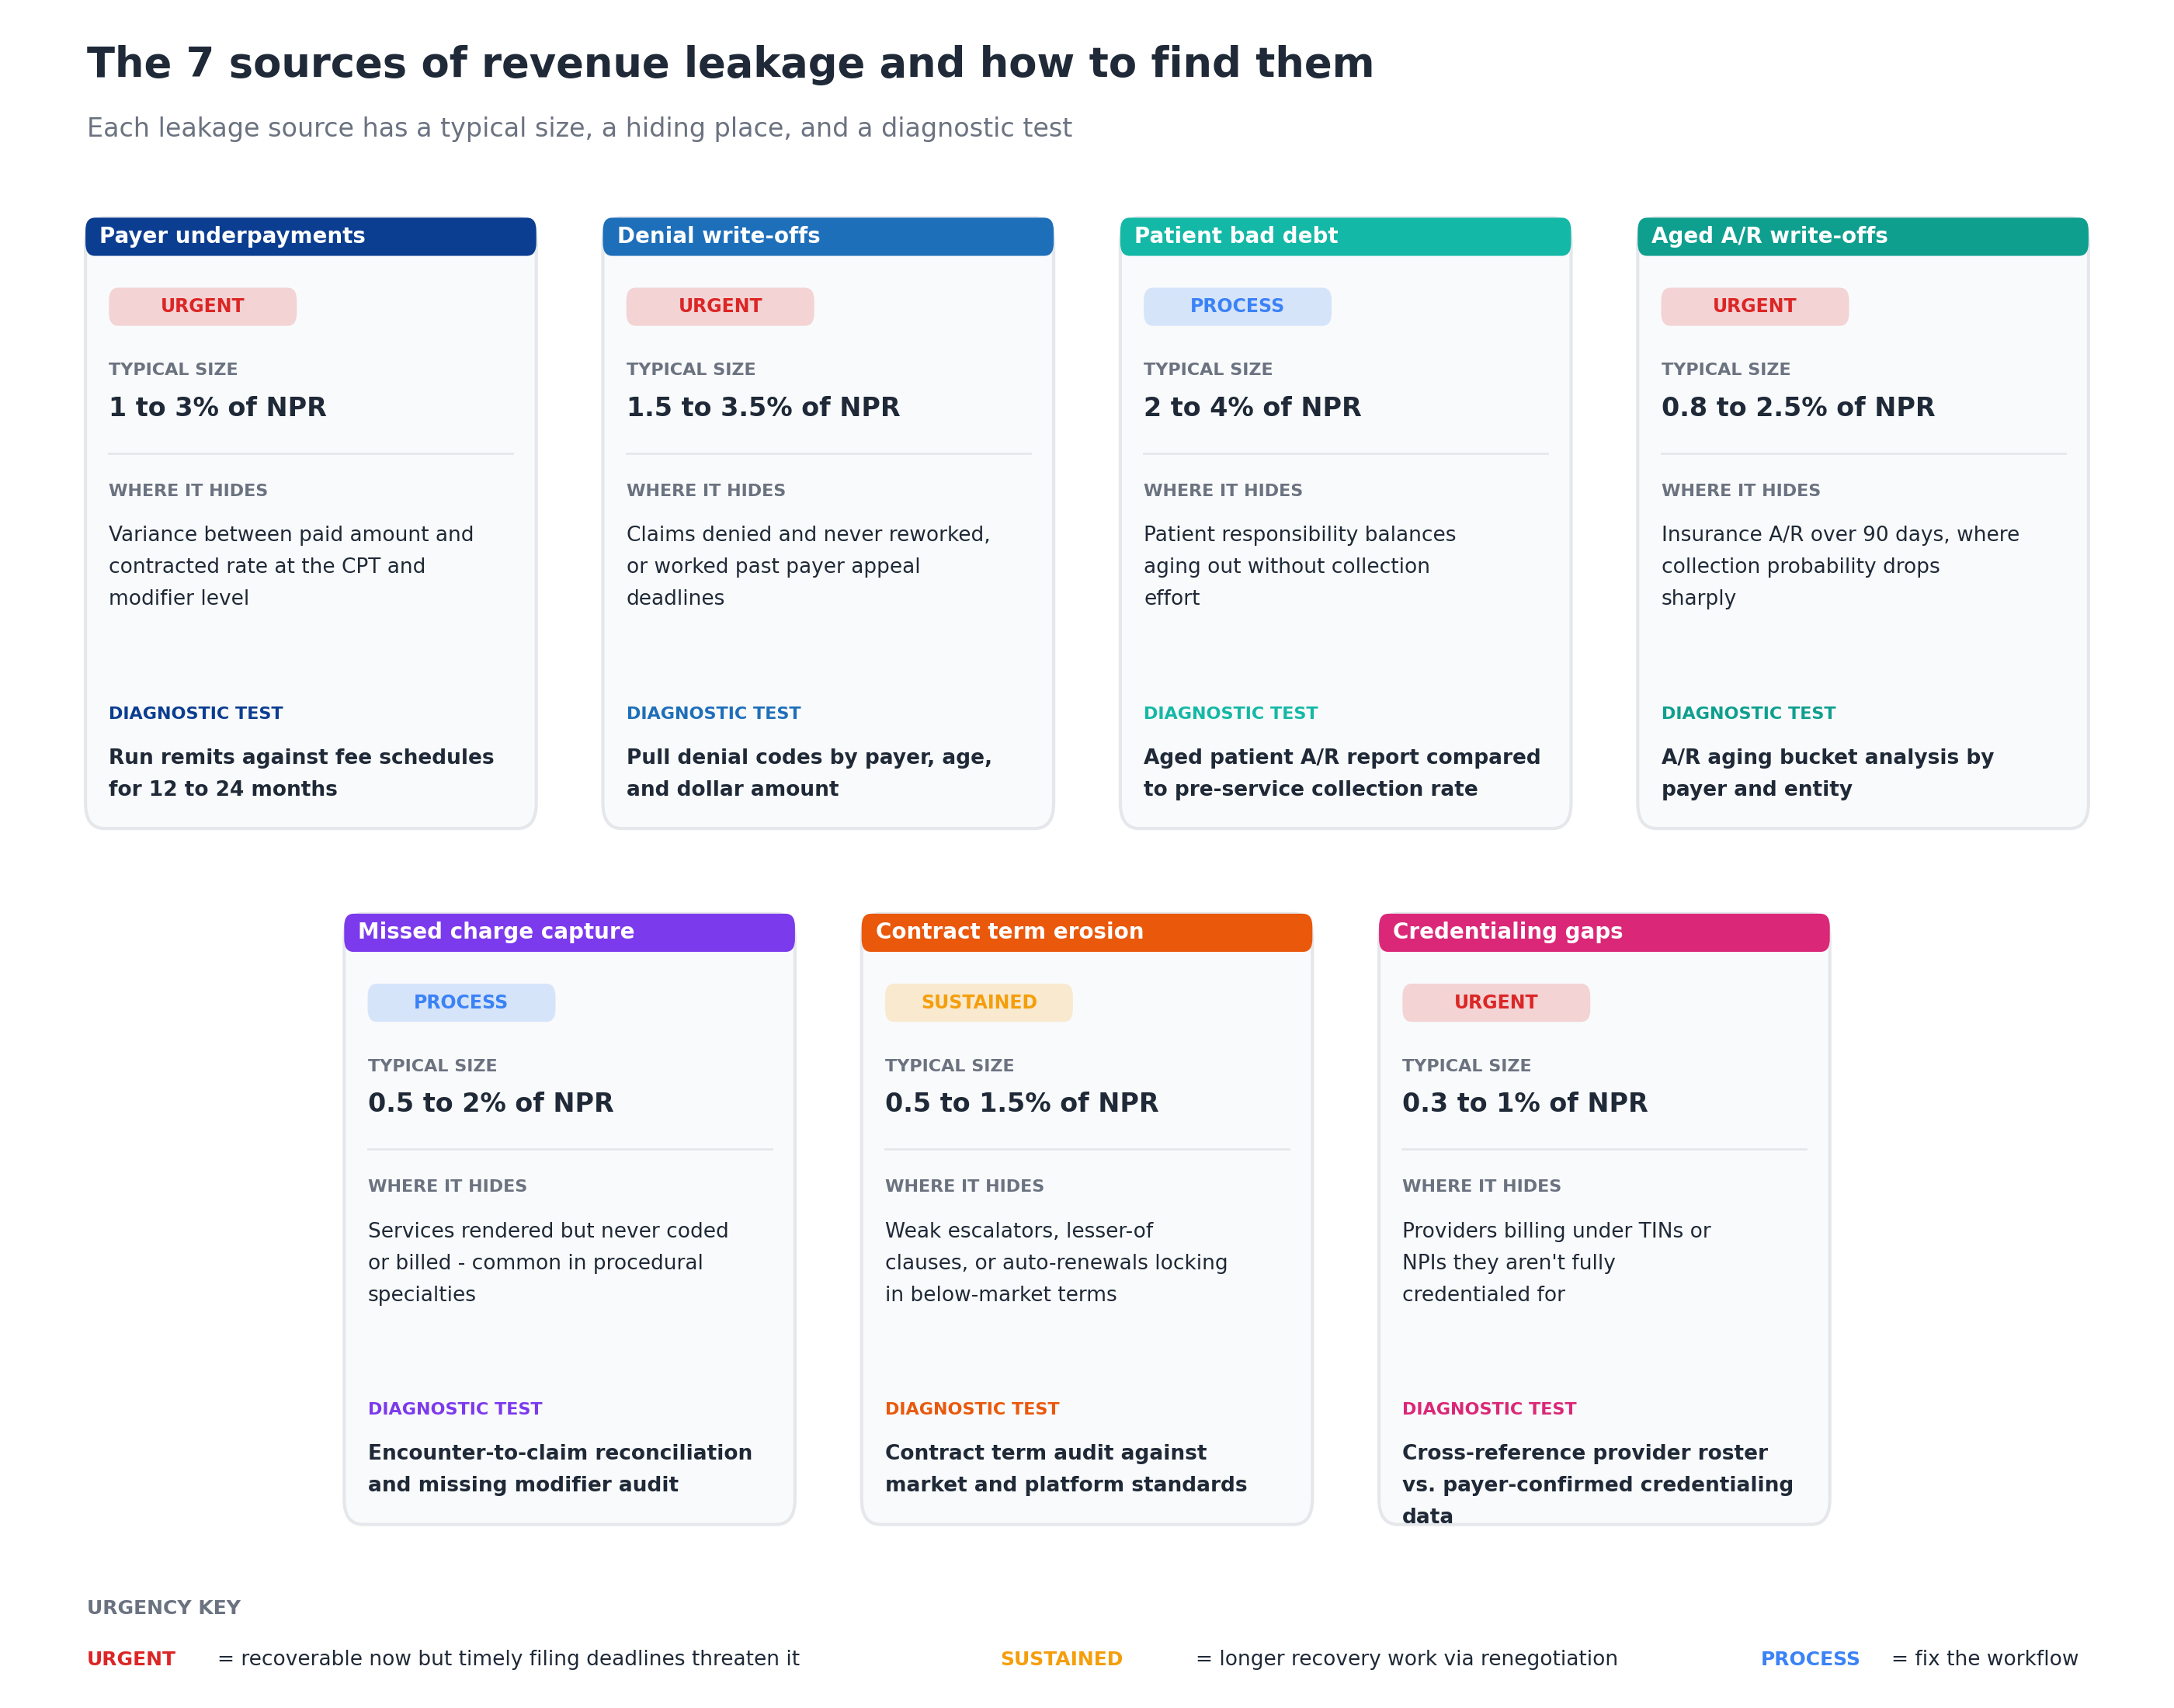
Source 1: Payer underpayments
Payer underpayments are the variance between the amount the payer actually paid and the rate the contract specifies, captured at the CPT and modifier level. The mechanic is straightforward: a payer agreed to pay $187.50 for CPT 99214, paid $176.25, and the practice posted the payment without alerting on the variance.
Typical size: 1 to 3 percent of net patient revenue per year.
Where it hides: In paid claims, not denied claims. This is what makes underpayments insidious. The cash arrives. The EOB looks normal. Only systematic comparison against the contracted fee schedule surfaces the gap.
Diagnostic test: Run 12 to 24 months of remits against the loaded fee schedule for each payer. Variance threshold is typically 2 percent for routine codes and 5 percent for procedural codes. Sort by total dollar exposure to prioritize recovery work.
Recovery urgency: HIGH. Underpayment recovery is subject to payer-specific timely filing windows, often 90 to 180 days. Stale underpayments age out of recoverability quickly, which is why every day of delay reduces the recoverable pool.
Source 2: Denial write-offs
Denial write-offs are claims that were denied at first pass and never successfully reworked, either because the appeal was never filed, the appeal failed, or the appeal deadline passed before anyone got to it. Initial denial rates have climbed steadily, with industry research finding that denials have risen to nearly 12 percent of submitted claims.
Typical size: 1.5 to 3.5 percent of net patient revenue per year.
Where it hides: In aged work queues, written-off claim batches, and the personal task lists of biller staff who didn't have time to get to them. Many practices have hundreds of low-dollar denials sitting in queues that nobody plans to work because the rework economics don't pencil out.
Diagnostic test: Pull denial codes by payer, by age, and by dollar amount. Look for patterns: a single payer producing disproportionate denials, a denial code that appears in volume, a date range where denial rates spiked. Cross-reference against active payer policy changes to identify systemic issues.
Recovery urgency: HIGH. Payer appeal windows are typically shorter than timely filing windows, often 60 to 120 days from the original denial. The recoverable pool shrinks every week.
Source 3: Patient bad debt
Patient bad debt is the portion of patient responsibility (deductibles, copays, coinsurance) that the practice fails to collect. The Kodiak Solutions benchmark shows patient collection rates fell from 54.8 percent in 2021 to 47.8 percent in 2023, with rising deductibles and weakening payer enforcement of patient cost-sharing.
Typical size: 2 to 4 percent of net patient revenue per year.
Where it hides: In aged patient A/R, particularly balances over 90 days. Acquired practices without automated patient estimation or pre-service collection workflows typically have the worst exposure because patients leave without paying their portion and are difficult to collect from later.
Diagnostic test: Aged patient A/R report compared to pre-service collection rate. The benchmark is collecting more than 70 percent of patient responsibility at or before the visit. Anything below that indicates a process gap.
Recovery urgency: PROCESS. One-time recovery work on aged patient balances has limited returns. The dollars come from fixing the upfront collection process, which is recurring revenue rather than one-time recovery.
Source 4: Aged A/R write-offs
Aged A/R write-offs are insurance receivables that age past the point where collection is economically viable. Collection probability drops below 65 percent past 120 days and below 41 percent past 180 days, which is why the industry benchmark for A/R over 90 days is 18 percent or less of total A/R.
Typical size: 0.8 to 2.5 percent of net patient revenue per year.
Where it hides: In the aging bucket reports that nobody runs weekly. Acquired practices commonly carry 28 to 35 percent of total A/R in the 90-plus bucket, well above benchmark, indicating staff are working current claims and ignoring aged ones.
Diagnostic test: A/R aging bucket analysis by payer and by entity. Compare against industry benchmarks (under 18 percent in the 90-plus bucket) and pull the longest-aged claims to investigate root cause.
Recovery urgency: HIGH for claims under 180 days, LOW for older claims. Aged claims under timely filing limits are recoverable with appropriate work. Older claims are usually permanent losses.
Source 5: Missed charge capture
Missed charge capture is services that were rendered but never coded or billed. Common in procedural specialties where modifier-driven coding (modifier 26 for professional component, modifier 59 for distinct procedural service) is complex and easy to skip.
Typical size: 0.5 to 2 percent of net patient revenue per year.
Where it hides: In the encounter records that don't tie to claims. EHR-generated encounters that never produce a charge. Procedures performed but not coded to the highest specificity. Bundled procedures where individual codes were dropped.
Diagnostic test: Encounter-to-claim reconciliation. Pull every encounter from the EHR and match against every claim in the practice management system. Investigate the gap. Run a separate missing-modifier audit for procedural specialties.
Recovery urgency: PROCESS. Charge capture issues require workflow fixes (coder training, EHR template updates, charge entry process changes). One-time recovery is limited by timely filing windows.
Source 6: Contract term erosion
Contract term erosion is the gradual loss of value from contract provisions that haven't kept up with the market: escalators below CPI, lesser-of-billed-charges clauses that cap reimbursement, weak prompt-pay terms, and auto-renewals that lock in below-market rates. The terms aren't rate problems per se, but they steadily reduce the effective rate.
Typical size: 0.5 to 1.5 percent of net patient revenue per year.
Where it hides: In contract language that gets reviewed once at signing and never again. Auto-renewal provisions extend the original terms indefinitely. Lesser-of clauses produce stealth underpayments that variance analysis catches but doesn't explain.
Diagnostic test: Contract term audit against market and platform standards. Compare each contract's escalator, renewal terms, lesser-of provisions, and notice requirements against MSO platform defaults.
Recovery urgency: SUSTAINED. Term improvements require contract renegotiation, which usually happens at renewal cycles. The work runs 6 to 18 months but the value is recurring once captured.
Source 7: Credentialing gaps
Credentialing gaps are claims billed under TINs or NPIs that the provider isn't fully credentialed for. Most commonly these surface as denials, but some payers process the claim and reduce the payment instead of denying outright.
Typical size: 0.3 to 1 percent of net patient revenue per year.
Where it hides: In the gap between the provider roster and the payer-confirmed credentialing data. Acquired practices routinely have providers credentialed under the legacy TIN but not under the MSO master TIN, providers credentialed with some payers but not others, and recently joined providers whose credentialing applications are still pending.
Diagnostic test: Cross-reference the provider roster against payer-confirmed credentialing data, payer by payer. Investigate every gap and document the remediation status.
Recovery urgency: HIGH. Active credentialing gaps produce denials every day they remain unresolved. The fix takes 90 to 120 days per payer per provider once started, so delay compounds the leakage.
How to detect revenue leakage in a newly acquired practice
The detection methodology runs in two parallel tracks: one for one-time historical recovery (the leakage that already happened and might still be recoverable) and one for systemic process gaps (the workflows that are still producing leakage every week).
The historical recovery diagnostic:
- Pull 12 to 24 months of remits for every payer at the acquired entity
- Load contracted fee schedules at the CPT and modifier level into a variance detection platform
- Calculate variance between paid amounts and contracted rates for every line item
- Aggregate by payer, by CPT, by provider, by site to identify concentration patterns
- Sort the results by total dollar exposure and timely filing urgency
The systemic gap diagnostic:
- Map the workflows for billing, denial management, patient collections, and credentialing
- Identify the documentation gaps in payer contracts, fee schedules, and credentialing files
- Compare current KPIs against platform benchmarks for net collection rate, denial rate, days in A/R, A/R over 90, and patient collection rate
- Identify the largest gaps between current performance and platform benchmarks
- Trace each gap back to its workflow to determine whether the fix is process change or systems consolidation
Most MSO integration teams complete the historical diagnostic in 30 to 45 days post-close and the systemic diagnostic across the broader first 90 days. For the operational sequencing of this work, see the 90-day RCM integration checklist.
The revenue leakage recovery playbook
Once leakage is identified, recovery work needs to be sequenced. The seven sources have very different urgency profiles and recovery mechanics, so attacking them in the wrong order leaves money on the table.
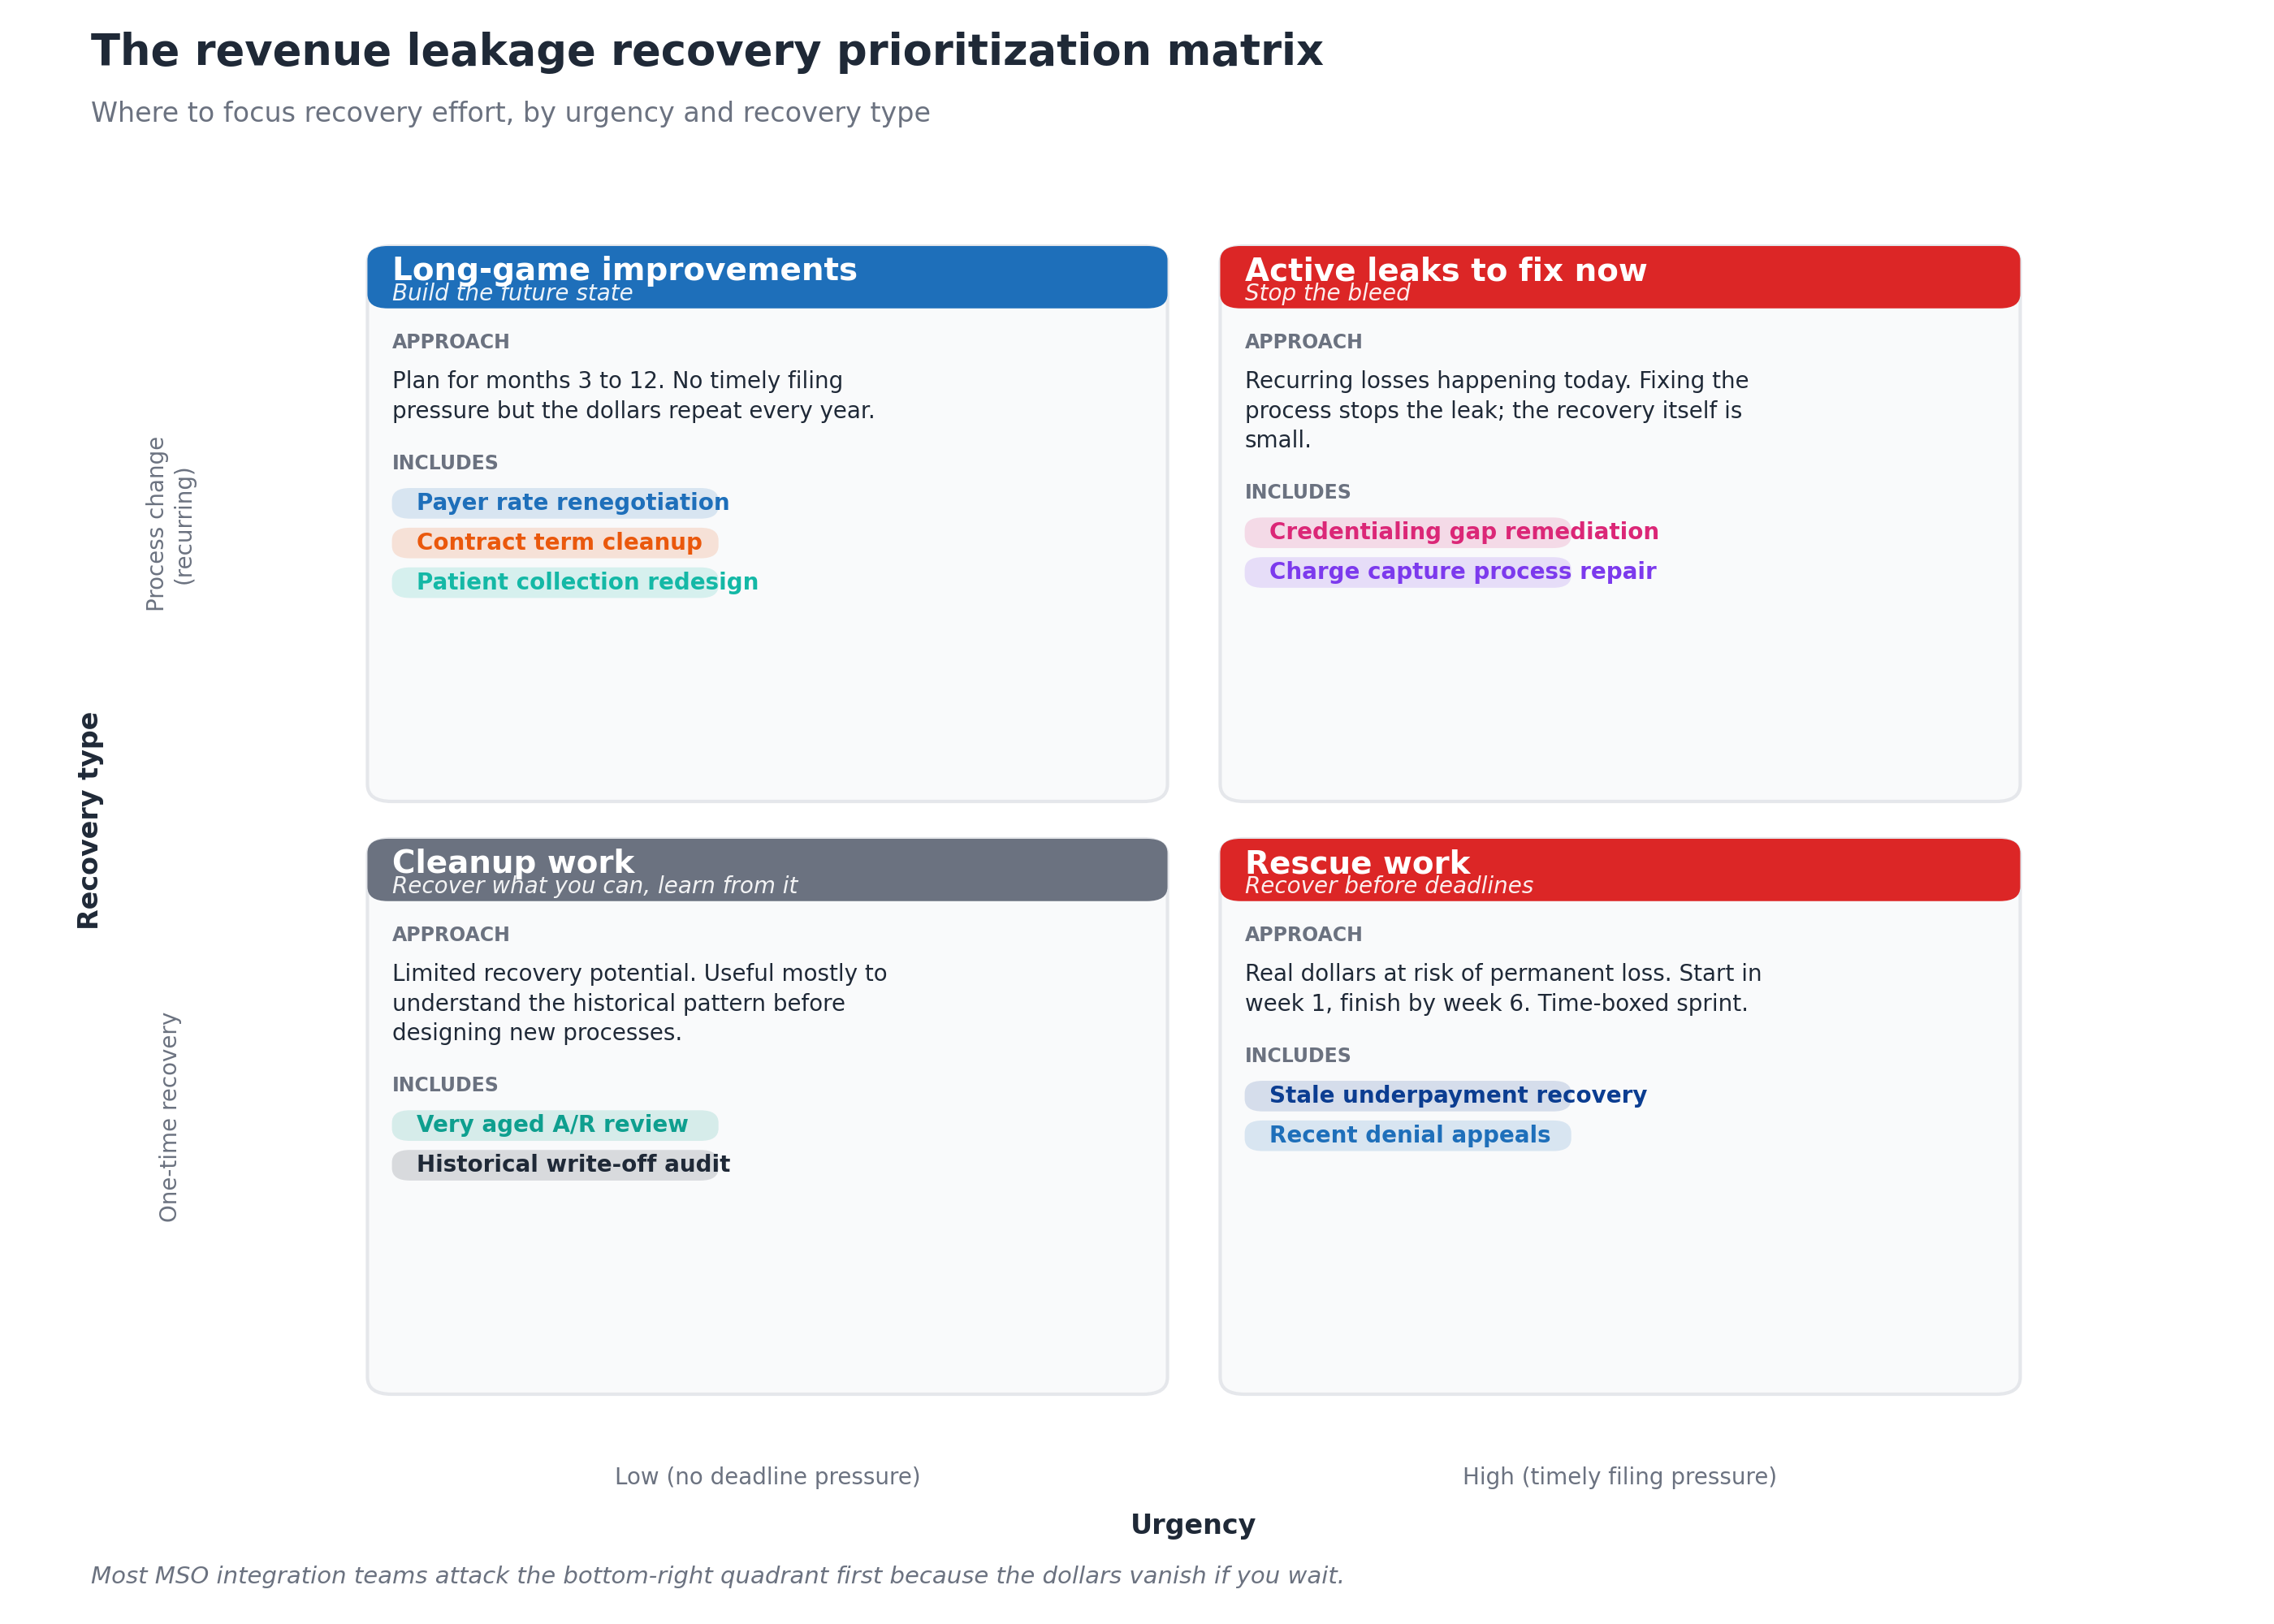
The four quadrants drive the sequencing:
Rescue work (high urgency, one-time recovery) gets attacked first. Stale underpayments and recent denials carry timely filing pressure that means every week of delay reduces the recoverable pool. These are time-boxed sprints, usually completed within 6 weeks of detection. Most MSO integration teams start this work in the first two weeks post-close, before the systematic diagnostic is even complete.
Active leaks to fix now (high urgency, process change) come second. Credentialing gaps producing daily denials and charge capture process failures producing daily revenue loss need to be stopped immediately, even though the one-time recoverable dollars are small. The value here is in stopping the bleed.
Long-game improvements (low urgency, process change) start in months 2 to 4. Payer rate renegotiation, contract term cleanup, and patient collection redesign all require structural work that takes 3 to 12 months. The dollars are large but recurring, so the urgency comes from getting them started, not from completing them quickly.
Cleanup work (low urgency, one-time recovery) is the lowest priority. Very aged A/R and historical write-off audits are useful primarily to understand the historical pattern before designing new processes, not because the recovery pool is meaningful.
The single biggest sequencing mistake is putting the long-game work first because it has the largest projected dollars. The compounding cost of delay on rescue work usually exceeds the benefit of accelerating long-game work, and once the timely filing windows close, those dollars are permanently lost.
How to size revenue leakage before close
The most effective place to size leakage is in pre-close diligence, before the deal terms are locked. Pre-close visibility produces three benefits: it sharpens the synergy thesis, it supports purchase price adjustments, and it lets the integration team start recovery work on Day 1 with the target opportunities already identified.
The pre-close sizing methodology:
- Request 12 months of remit data alongside the standard financial diligence package
- Sample 90 days of paid claims against contracted rates to estimate underpayment exposure
- Pull the denial code report for the trailing 12 months to estimate denial write-off exposure
- Run an aged A/R analysis to estimate write-off exposure and aging risk
- Review the credentialing status report to estimate credentialing gap exposure
- Audit a sample of payer contracts for terms erosion (escalators, lesser-of clauses)
The estimates produce a leakage range expressed as a percentage of net patient revenue. Most targets land in the 6 to 16 percent range. The midpoint estimate becomes the synergy thesis number that gets underwritten into the deal model.
Targets at the high end of the range (12 to 16 percent of NPR) usually warrant either a purchase price adjustment or specific working capital provisions that account for the recovery timeline. Targets at the low end (3 to 6 percent) often still justify the acquisition but produce smaller integration synergies than competitors might assume.
This pre-close sizing is part of the broader contract audit process detailed in the payer contract audit guide.
How long does it take to plug the leaks?
Different sources have very different recovery timelines.
- Stale underpayments and recent denials (rescue work): 30 to 90 days to recover the available pool, subject to payer timely filing windows
- Credentialing gap remediation (active leak): 90 to 120 days per payer per provider to fully resolve
- Charge capture process repair (active leak): 60 to 90 days to redesign and deploy the new workflow, with full impact landing within 4 to 6 months
- Payer rate renegotiation (long-game): 6 to 18 months from initial conversation to executed amendment
- Contract term renegotiation (long-game): 6 to 24 months, often tied to natural renewal cycles
- Patient collection redesign (long-game): 6 to 12 months to redesign workflows, deploy automated estimation, and measure improvement
- Aged A/R cleanup (low priority): 30 to 60 days to complete the audit and recover what's recoverable
Total time to fully plug the leaks: 12 to 24 months from acquisition close. The recurring annual benefit then continues every year afterward, which is why mature MSO platforms invest heavily in detection and recovery capabilities even when the immediate ROI feels slow.
Common mistakes in attacking revenue leakage
Most MSO platforms make at least two or three of these mistakes during their first few acquisitions.
Treating all seven sources as equally urgent. They aren't. The rescue quadrant has hard deadlines that the long-game work doesn't, and ignoring sequencing costs real dollars.
Skipping pre-close sizing. Without a baseline before close, the integration team has no way to measure recovery success and no way to defend the synergy thesis at the next PE board meeting.
Manual variance analysis at scale. Trying to detect underpayments in spreadsheets reliably misses the long tail of small variances that, in aggregate, account for 60 to 70 percent of the recoverable dollars. The detection has to be systematic and continuous.
Recovering historical leakage without fixing the underlying process. A one-time underpayment recovery sweep is useful, but if the variance detection isn't continuous, the leakage starts compounding again the day after the sweep ends.
Treating leakage as a billing problem. Several of the seven sources (contract terms, credentialing, charge capture) sit outside the billing department. Centralizing leakage detection in billing alone misses the systemic causes.
Underestimating the people cost. Leakage detection produces work. The recovery queue needs staff to actually file the appeals, contest the underpayments, and remediate the credentialing gaps. Many platforms detect leakage they can't recover because they didn't staff the recovery work.
Technology that surfaces revenue leakage at scale
Three technology categories make leakage detection and recovery work at MSO scale.
Contract management with continuous variance detection. The platform needs to ingest every payer contract and fee schedule across every TIN, with rate data captured at the CPT and modifier level, and run variance detection continuously rather than as a one-time project. Generalist contract tools often miss this because they were built for contract terms management rather than fee schedule analysis. MD Clarity's guide to fee schedule reimbursement walks through what the technical setup needs to handle.
Underpayment detection at scale. Once contracts are loaded, the same engine should be detecting variances on every TIN against the right fee schedule, routing recovery work to the appropriate team, and tracking recovery success rates.
Denial management and patient estimation. For the denial-driven leakage and the patient bad debt leakage, separate workflow capabilities are needed: standardized denial categorization with appeals tracking, and automated patient estimation with upfront collection support. MD Clarity's guide to payer contract management for MSOs covers how these capabilities integrate with the broader managed care function.
Frequently asked questions about revenue leakage in post-acquisition practices
What is revenue leakage in a healthcare practice?
Revenue leakage in a healthcare practice is the gap between the revenue the practice should be capturing under its existing contracts and patient mix and the revenue it actually collects. It spans payer underpayments, denial write-offs, patient bad debt, aged A/R write-offs, missed charge capture, contract term erosion, and credentialing gaps. Each source has distinct mechanics, but they all compound silently because most practices have no system that continuously detects them.
How much revenue leakage is typical for a newly acquired physician practice?
Mid-range acquired practices leak between 6 and 16 percent of net patient revenue per year, with the midpoint around 12 percent. For a $50 million net patient revenue practice, that translates to $3 to $8 million per year in recoverable annual exposure. The variance comes from how disciplined the prior owner was about variance detection, denial management, and patient collections.
What is the difference between revenue leakage and denials?
Denials are one source of revenue leakage but not the same thing. A denied claim that gets successfully appealed produces no leakage. A denied claim that never gets worked, or that gets worked past the appeal deadline, produces leakage that shows up as a write-off. Revenue leakage spans six other sources beyond denials, including payer underpayments on paid claims, patient bad debt, and contract term erosion.
Which source of revenue leakage is biggest?
Patient bad debt and denial write-offs typically run the largest dollar amounts, each at 2 to 4 percent of net patient revenue. Payer underpayments are usually close behind at 1 to 3 percent. The biggest source varies by specialty: procedural specialties often see higher underpayment exposure, primary care often sees higher patient bad debt, and recently acquired multi-provider groups often see disproportionate credentialing leakage.
How fast can revenue leakage be recovered?
Stale underpayments and recent denials can be recovered within 30 to 90 days subject to payer timely filing limits. Credentialing fixes take 90 to 120 days per payer per provider. Process improvements (charge capture, patient collections) require 60 to 180 days to deploy. Contract renegotiations and rate harmonization run 6 to 18 months. Full leakage closure typically takes 12 to 24 months from acquisition close.
How is revenue leakage detected?
Detection runs on two parallel tracks: historical recovery (running 12 to 24 months of paid remits against contracted fee schedules to surface underpayments, plus denial code analysis, plus aged A/R review) and systemic gap detection (comparing current KPIs against platform benchmarks for net collection rate, denial rate, days in A/R, and patient collection rate). Each track produces a prioritized list of recovery items.
Can revenue leakage be sized before closing an acquisition?
Yes. Pre-close diligence with access to 12 months of remit data, denial reports, and aged A/R can produce a leakage estimate accurate to within 1 to 2 percentage points of NPR. The estimate sharpens the synergy thesis, supports purchase price adjustments where appropriate, and lets the integration team start recovery work on Day 1 with target opportunities already identified.
Why do acquired practices leak more than steady-state practices?
Acquired practices typically run two to three times higher leakage exposure because of five compounding factors: no continuous variance detection, documentation gaps from the transition, personnel turnover during integration, manual denial workflows, and credentialing gaps that nobody is centrally monitoring. Each factor on its own creates moderate exposure, but they all show up together at the moment of close.
Make leakage detection a continuous capability
Revenue leakage in a post-acquisition physician practice is not a one-time problem to solve. It is a continuous risk to monitor, with new leaks appearing every time the payer mix changes, the provider roster shifts, or a payer pushes out a fee schedule change without notice. The MSO platforms that capture the most value are the ones whose leakage detection runs continuously across every TIN in the platform, surfacing variances within days rather than quarters.
MD Clarity helps MSO revenue cycle, managed care, and finance teams detect revenue leakage across every TIN, recover the dollars before timely filing deadlines, and design the workflows that prevent leakage from compounding. Request a demo or read about how an orthopedics MSO found $10.3 million in underpayments using this approach.
FAQs
Get paid in full by bringing clarity to your revenue cycle
Related Posts


Subscribe to the

Healthcare Clarified newsletter
Get the latest insights on RCM and healthcare policy in your inbox
